

Descrizione
Your Candles Are Lying To You. Order Flow Is The Truth.
Standard candlestick charts are an illusion. They show you where price went, but they completely hide the aggressive participation—the come e perché it got there.
You see a massive green breakout candle and buy the top. What you didn’t see was the hidden exhaustion—all the volume was trapped at the extreme high, and institutional sellers just absorbed every single market buy order. You just became their exit liquidity.
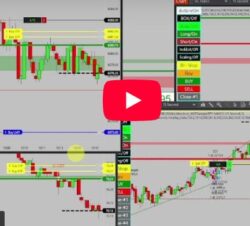
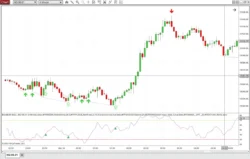
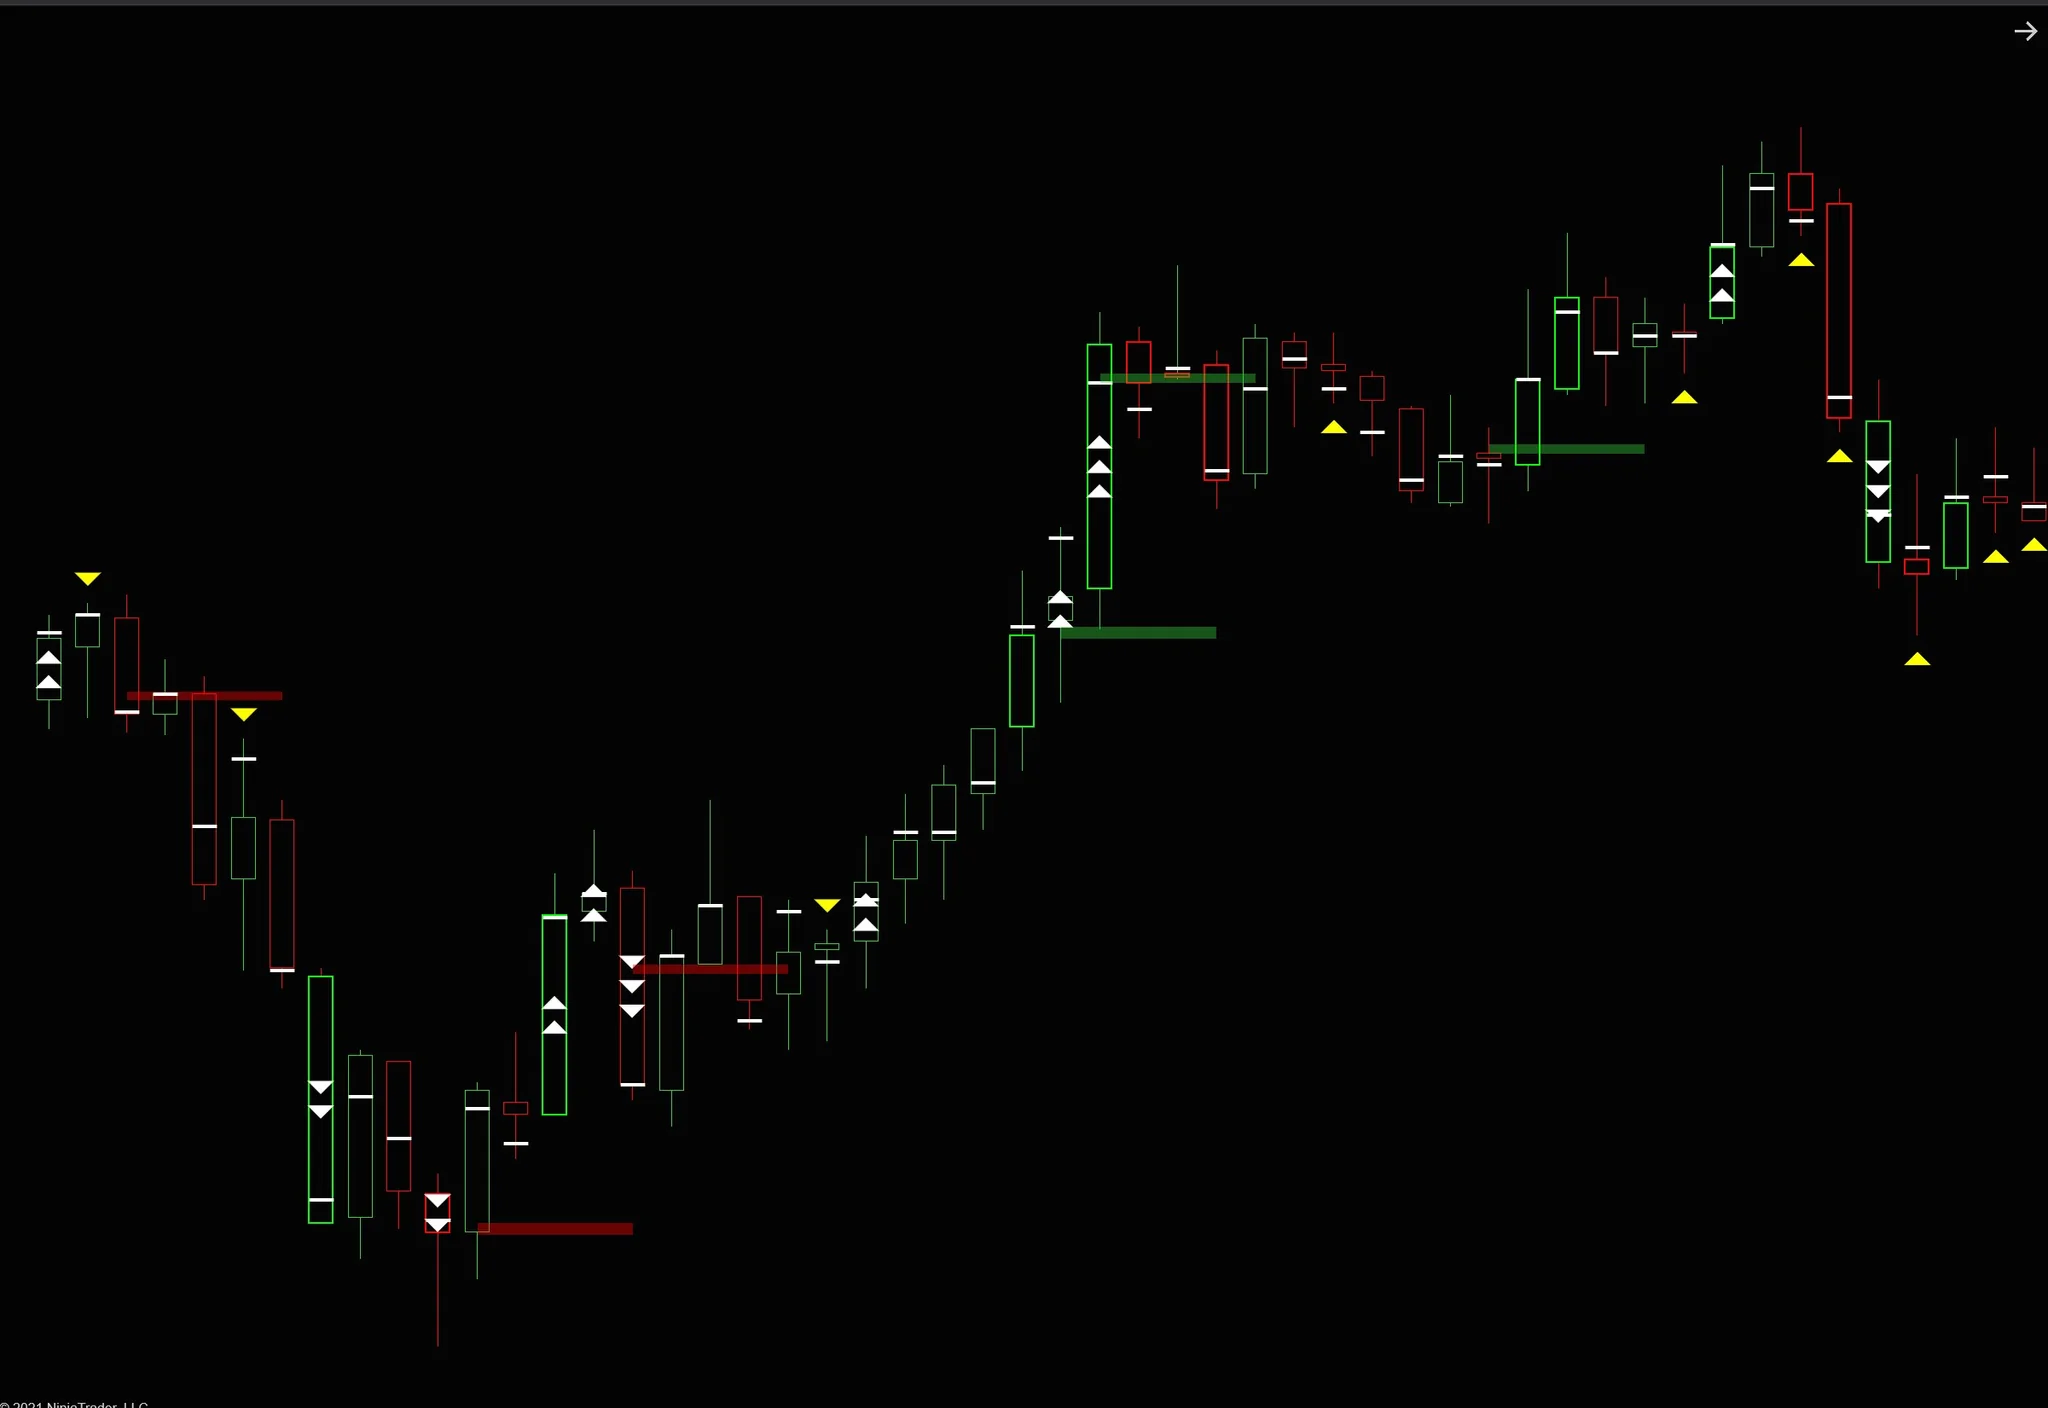
The Buy/Sell Momentum Indicator exposes this invisible liquidity. It layers institutional-grade order flow data directly onto your standard candlesticks. No need to decipher complex, cluttered footprint charts. When aggressive imbalances, trapped traders, or sudden momentum bursts occur, the exact signal is printed right on the candle where you need it.
Stop trading blind. See exactly where institutional volume is stacking, spot hidden divergences before the reversal happens, and execute with the mathematical certainty of true order flow.
You’re Trading Blind.
We Expose The Hidden Volume.
Retail traders react to empty price candles. Institutional algorithms react to aggressive delta and stacked imbalances. Stop guessing who is in control.
Empty Price Action
You make decisions based purely on candle shapes, completely unaware of the delta and volume trapped inside. This leaves you vulnerable to aggressive institutional traps and sudden reversals.
Buying The Exhaustion
You jump into a fast-moving trend, only to realize the move is already dead. Without seeing order flow exhaustion, you end up providing liquidity for smart money exiting their positions.
Visible Order Flow
The Buy/Sell Momentum tool translates complex footprint data into simple, actionable visual markers on standard candles, giving you institutional insight without the clutter of a footprint chart.
Spot Institutional Tops & Bottoms.
Exhaustion Detection
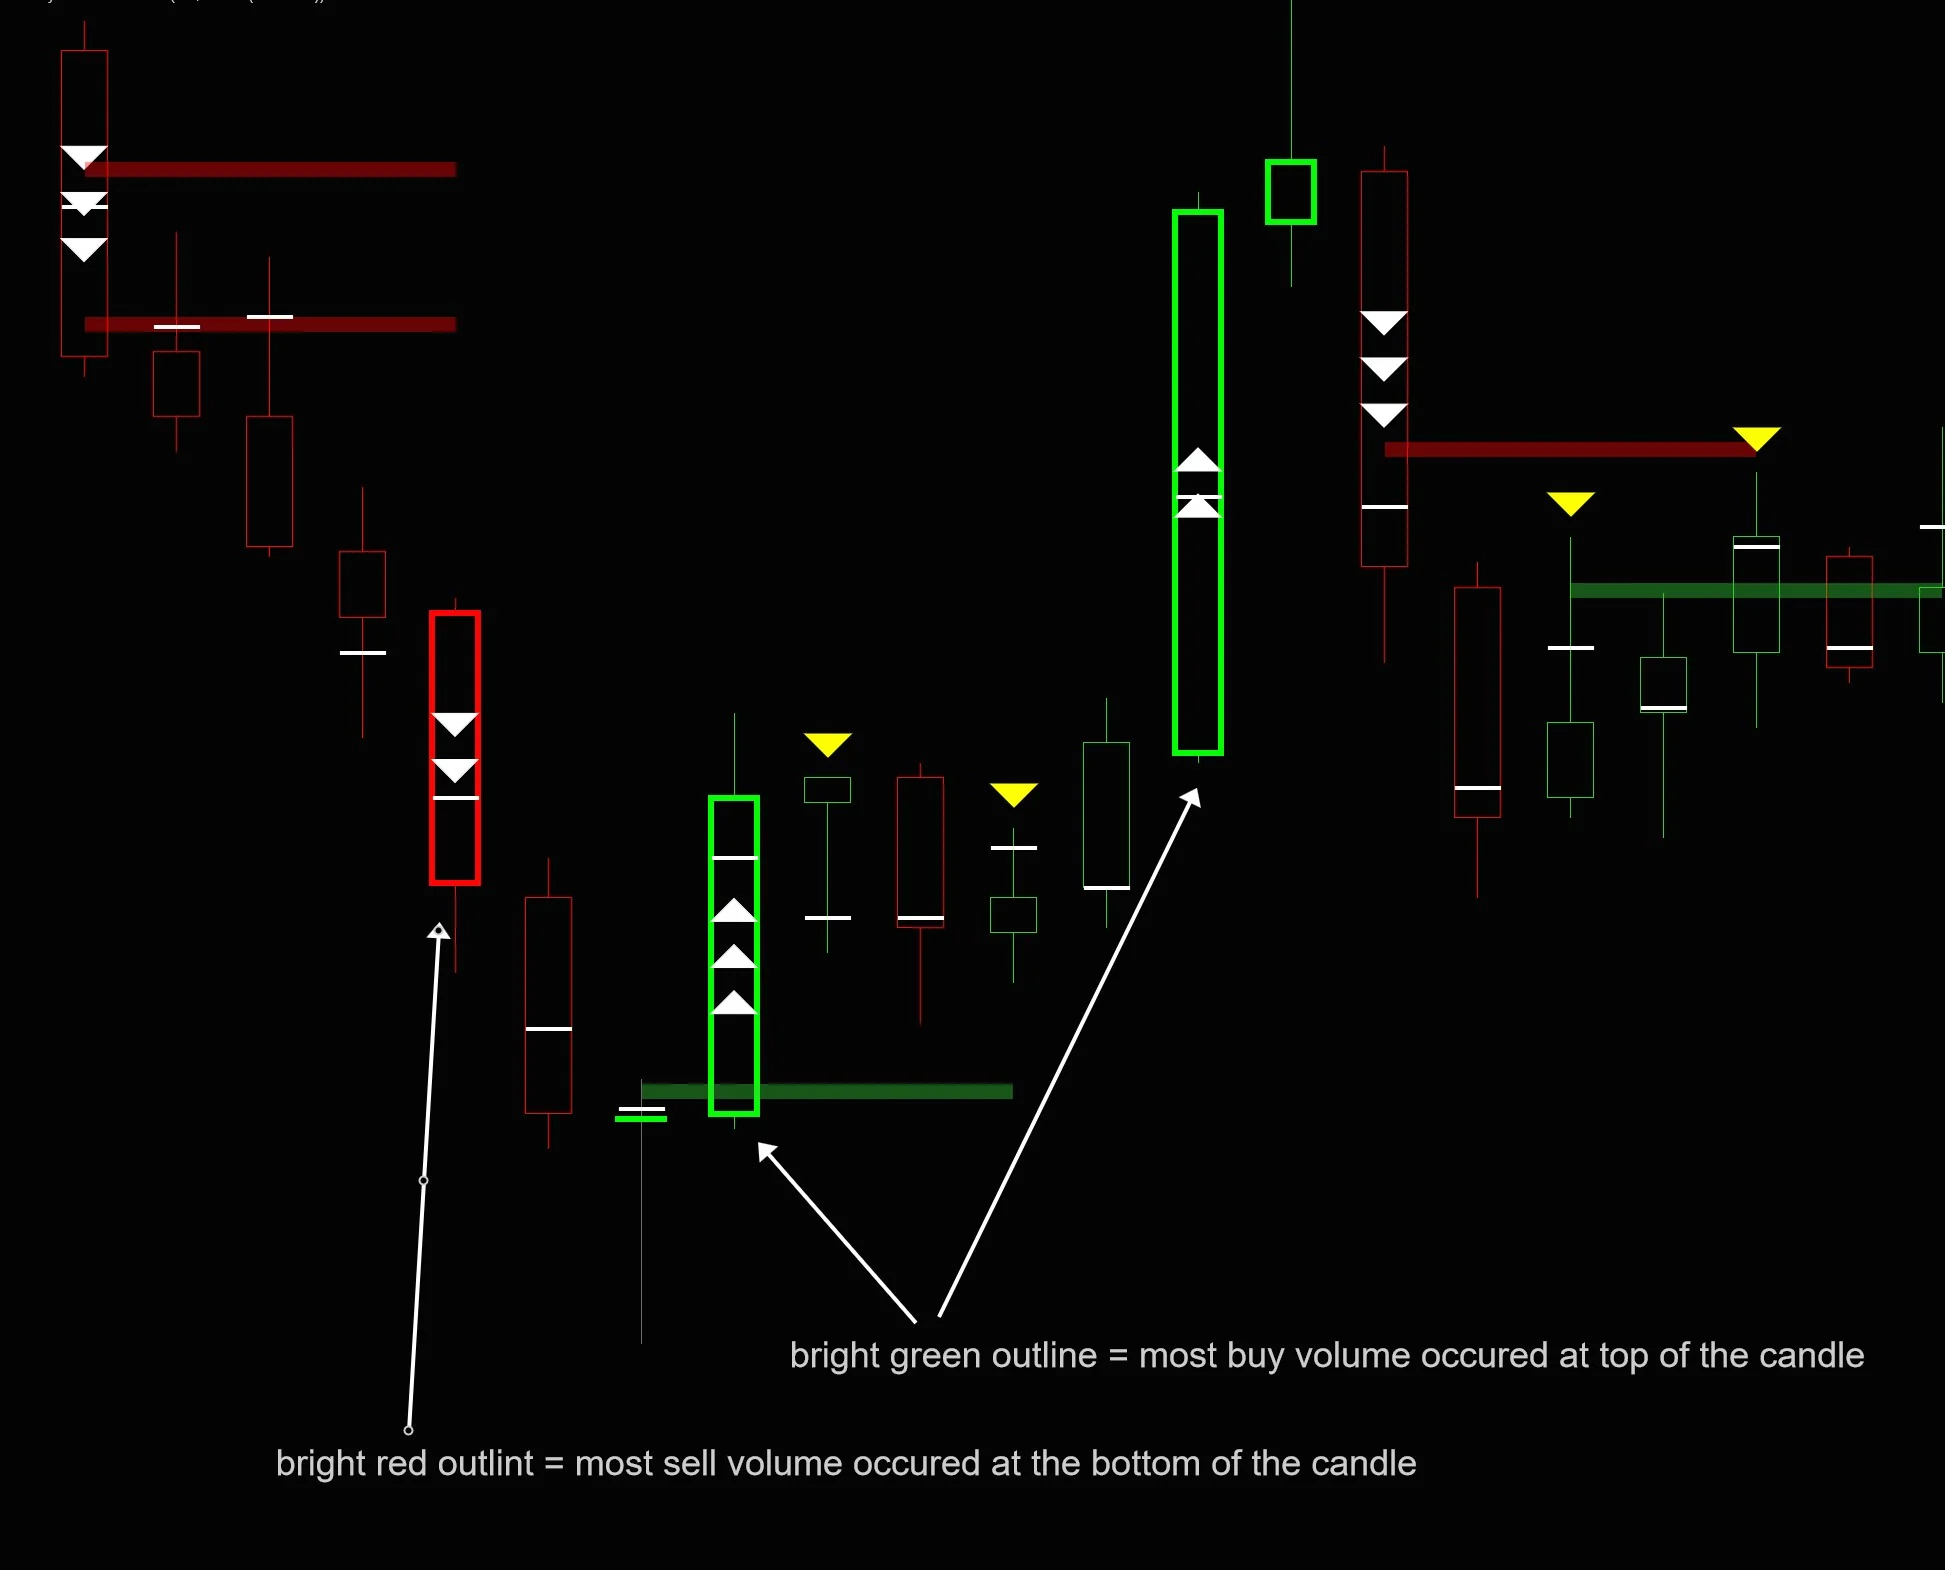
Standard candles hide volume distribution. This algorithm highlights candles with bright outlines where massive volume is trapped at the extreme edges, so you can instantly spot exhaustion and avoid buying the exact top or selling the absolute bottom.
- Outline high-conviction exhaustion moves instantly.
- Avoid late-entry traps where smart money is exiting.
- Detect hidden absorption on extreme candle wicks.
Trade Validated Liquidity Zones.
Institutional Support & Resistance
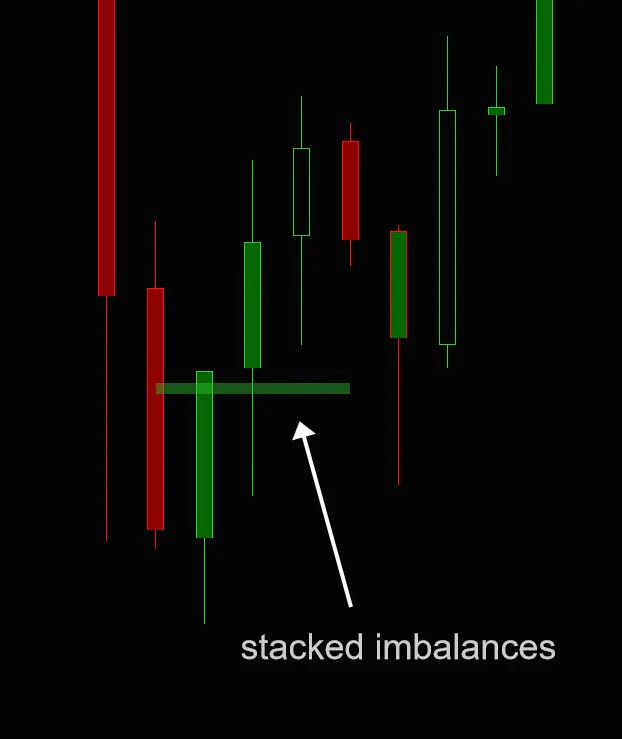
When aggressive buyers or sellers overwhelm the tape across multiple price ticks, a Stacked Imbalance is formed. The indicator permanently maps these heavy participation zones on your chart, giving you mathematically proven support and resistance levels to trade against.
- Identify exactly where institutional money entered by force.
- Trade bounces off mathematically proven support zones.
- Eliminate subjective and inaccurate line drawing entirely.
Ride Lightning-Fast Momentum.
Velocity Tracking
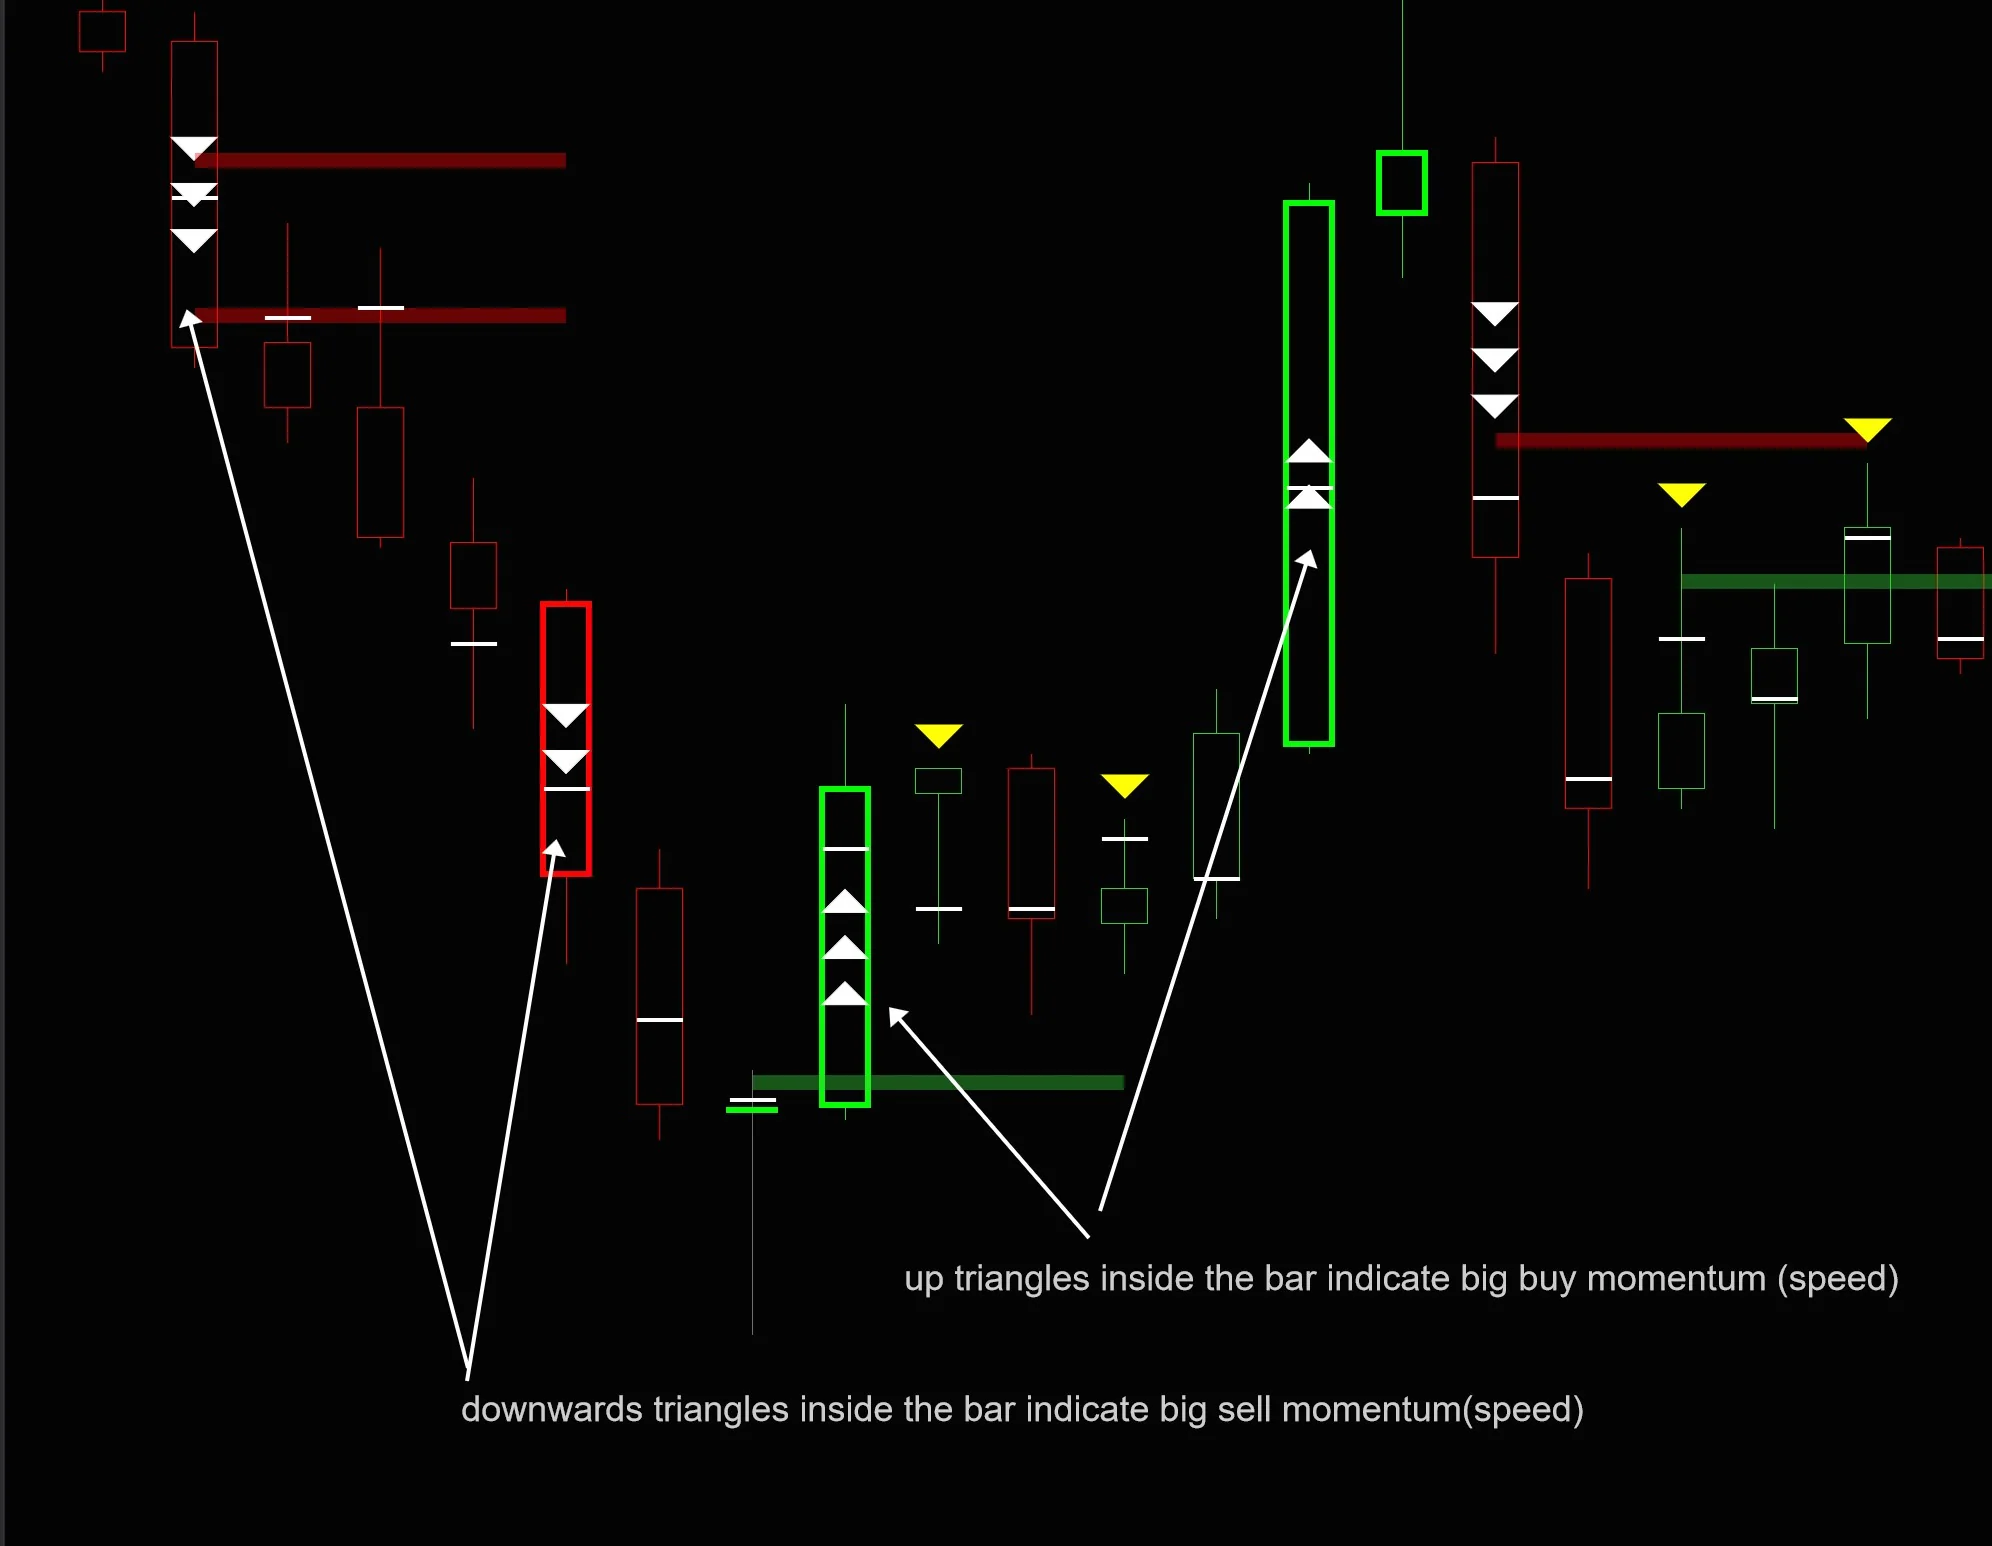
Speed dictates strength. When market activity spikes aggressively, proprietary triangle markers instantly render inside the candle. These markers grade the momentum from 1 to 3 arrows, allowing you to confidently hold winners when institutional volume pushes the pedal to the floor.
- Gauge real-time transaction speed visually.
- Confirm breakout validity with absolute volume velocity.
- Stay in the trade longer when speed is on your side.