 SeasonalSwingTrader - 3Sコードプロ


説明
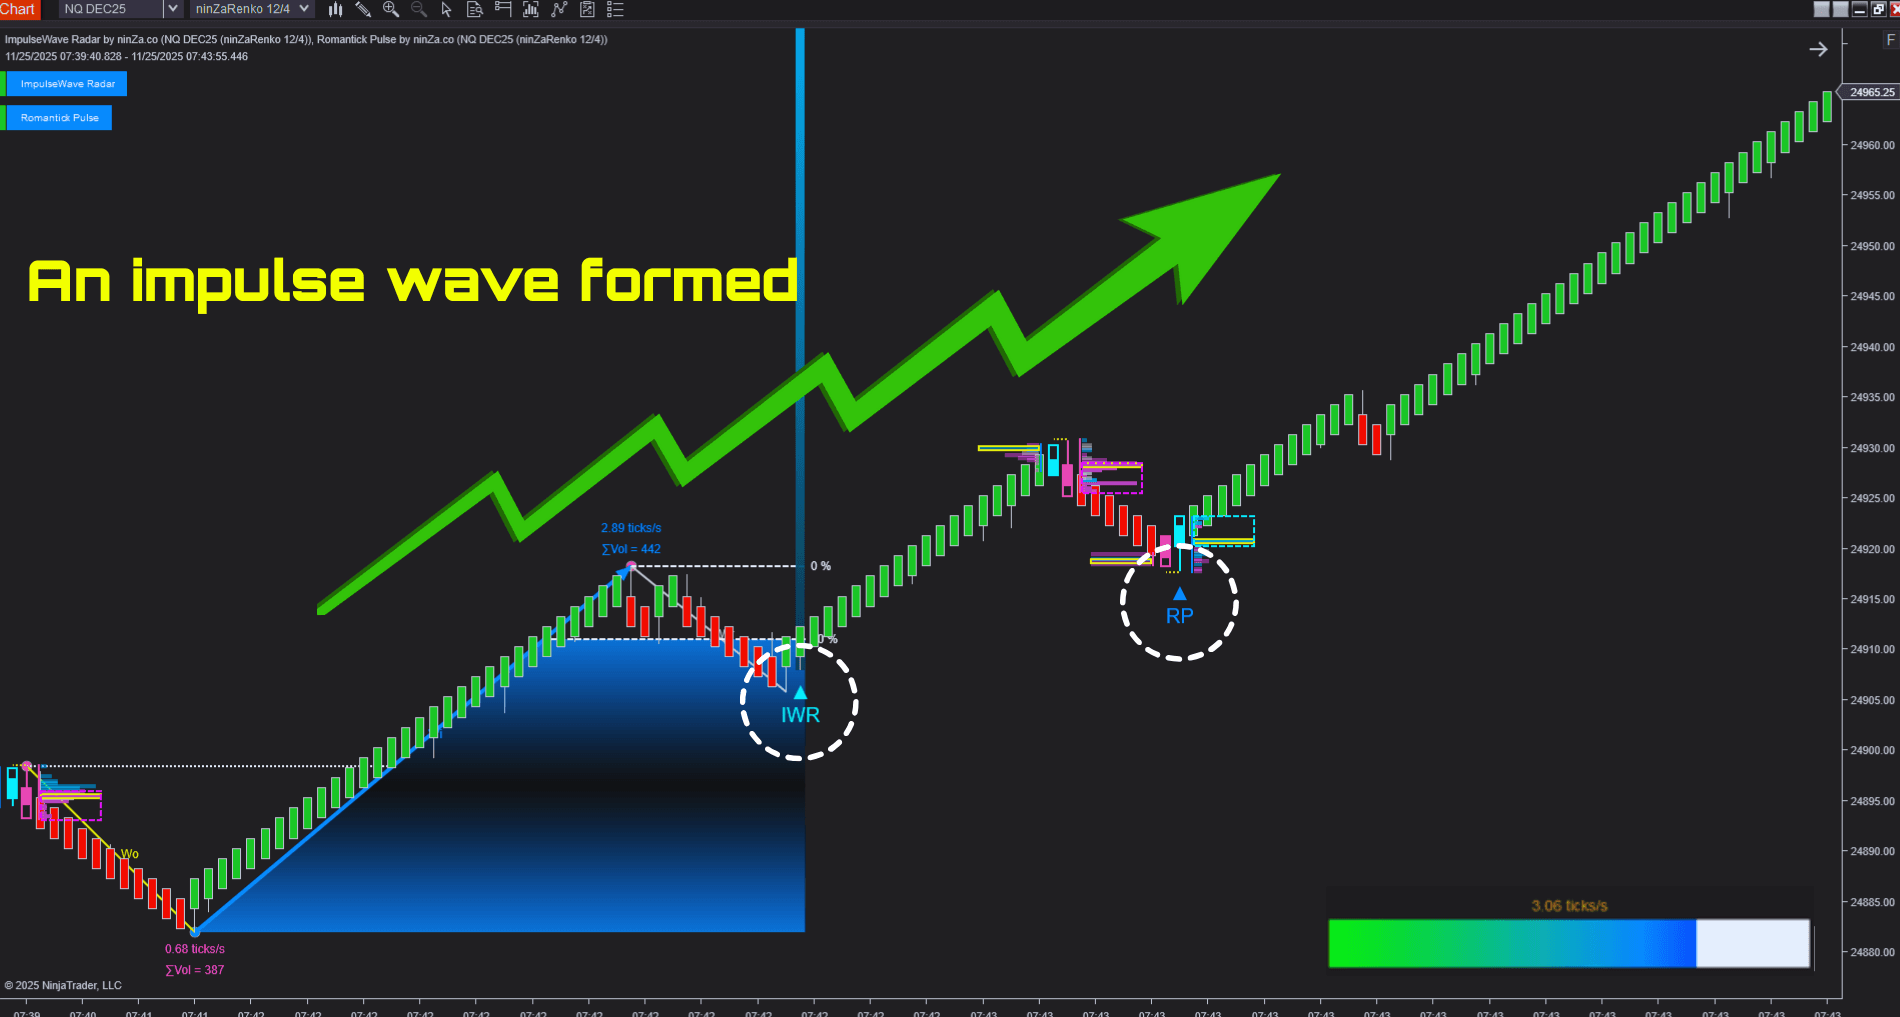
This is an Elliott Wave indicator for NinjaTrader 8 based on a dynamic 3-wave analyzer that tracks three consecutive waves: the base wave (W0), the impulse wave (Wi), and the corrective wave (Wr).
The indicator also incorporates trading speed (trades per second) and total volume to distinguish genuine impulse waves from minor fluctuations or market noise.
It is based on Elliott Wave theory—where the third wave in the sequence is typically the strongest—helping traders identify early entry points with greater confidence.
What is the Elliott Wave Theory?
Elliott Wave Theory is a method for analyzing market price movements based on cyclical wave patterns. According to this theory, price action unfolds in a series of waves, typically consisting of five “impulse waves” (moving with the trend) and three “corrective waves” (moving against the trend).
Notably, the third wave in the sequence is usually the strongest and longest-lasting, representing the most significant momentum within the trend.
Traders use Elliott Wave Theory to identify trend continuations, potential reversals, and optimal entry points by analyzing the structure and strength of the waves.
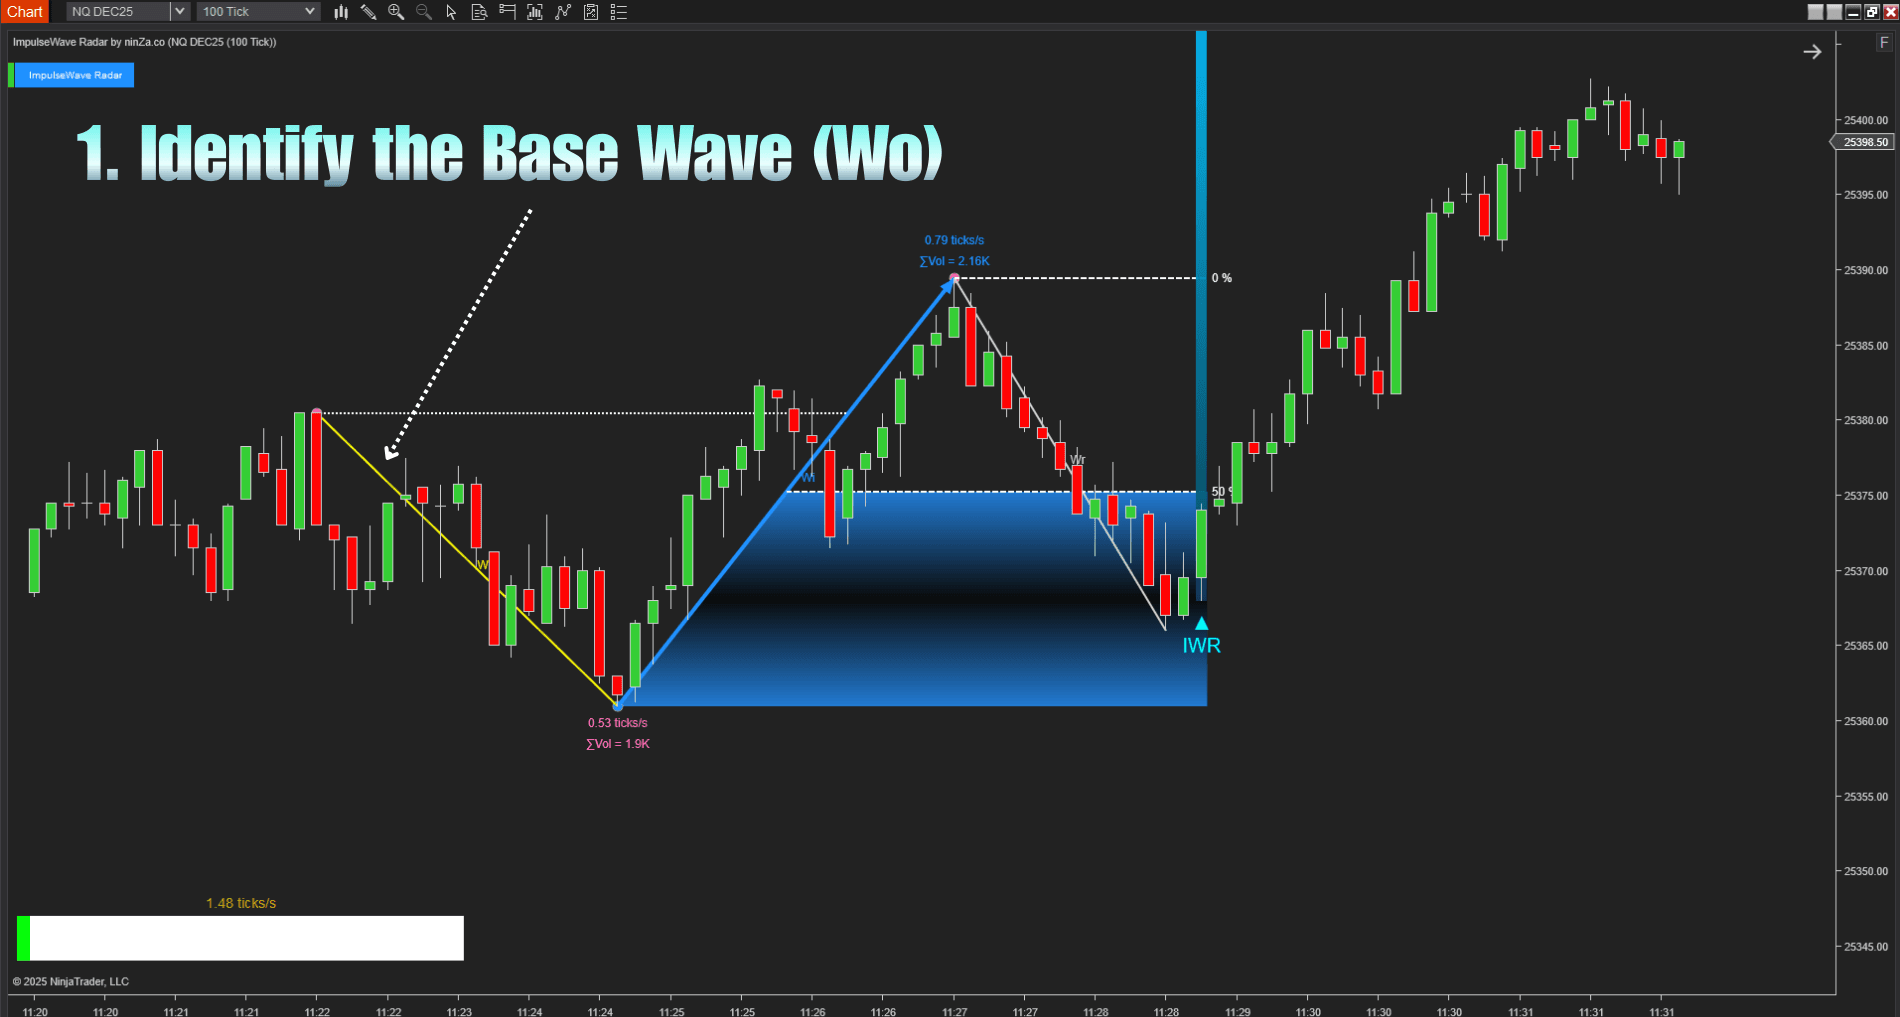
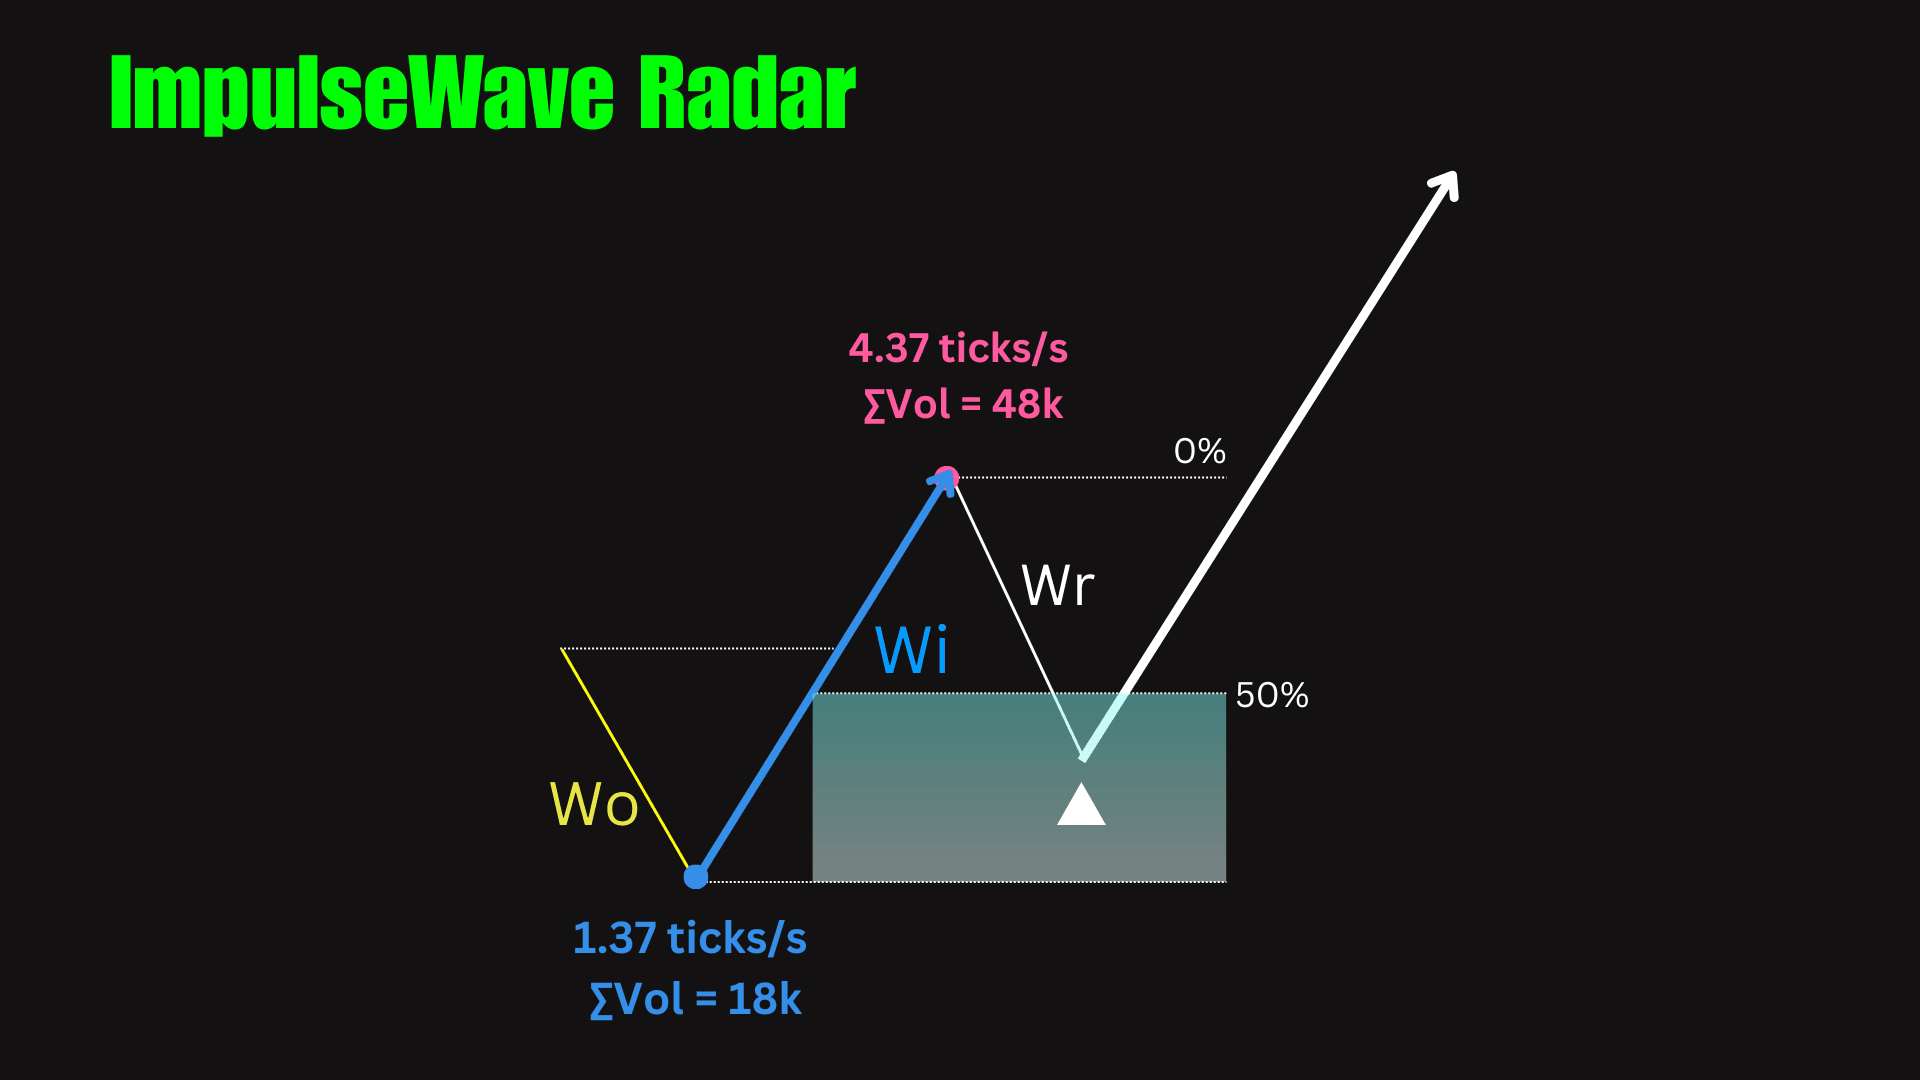
How the Radar Works
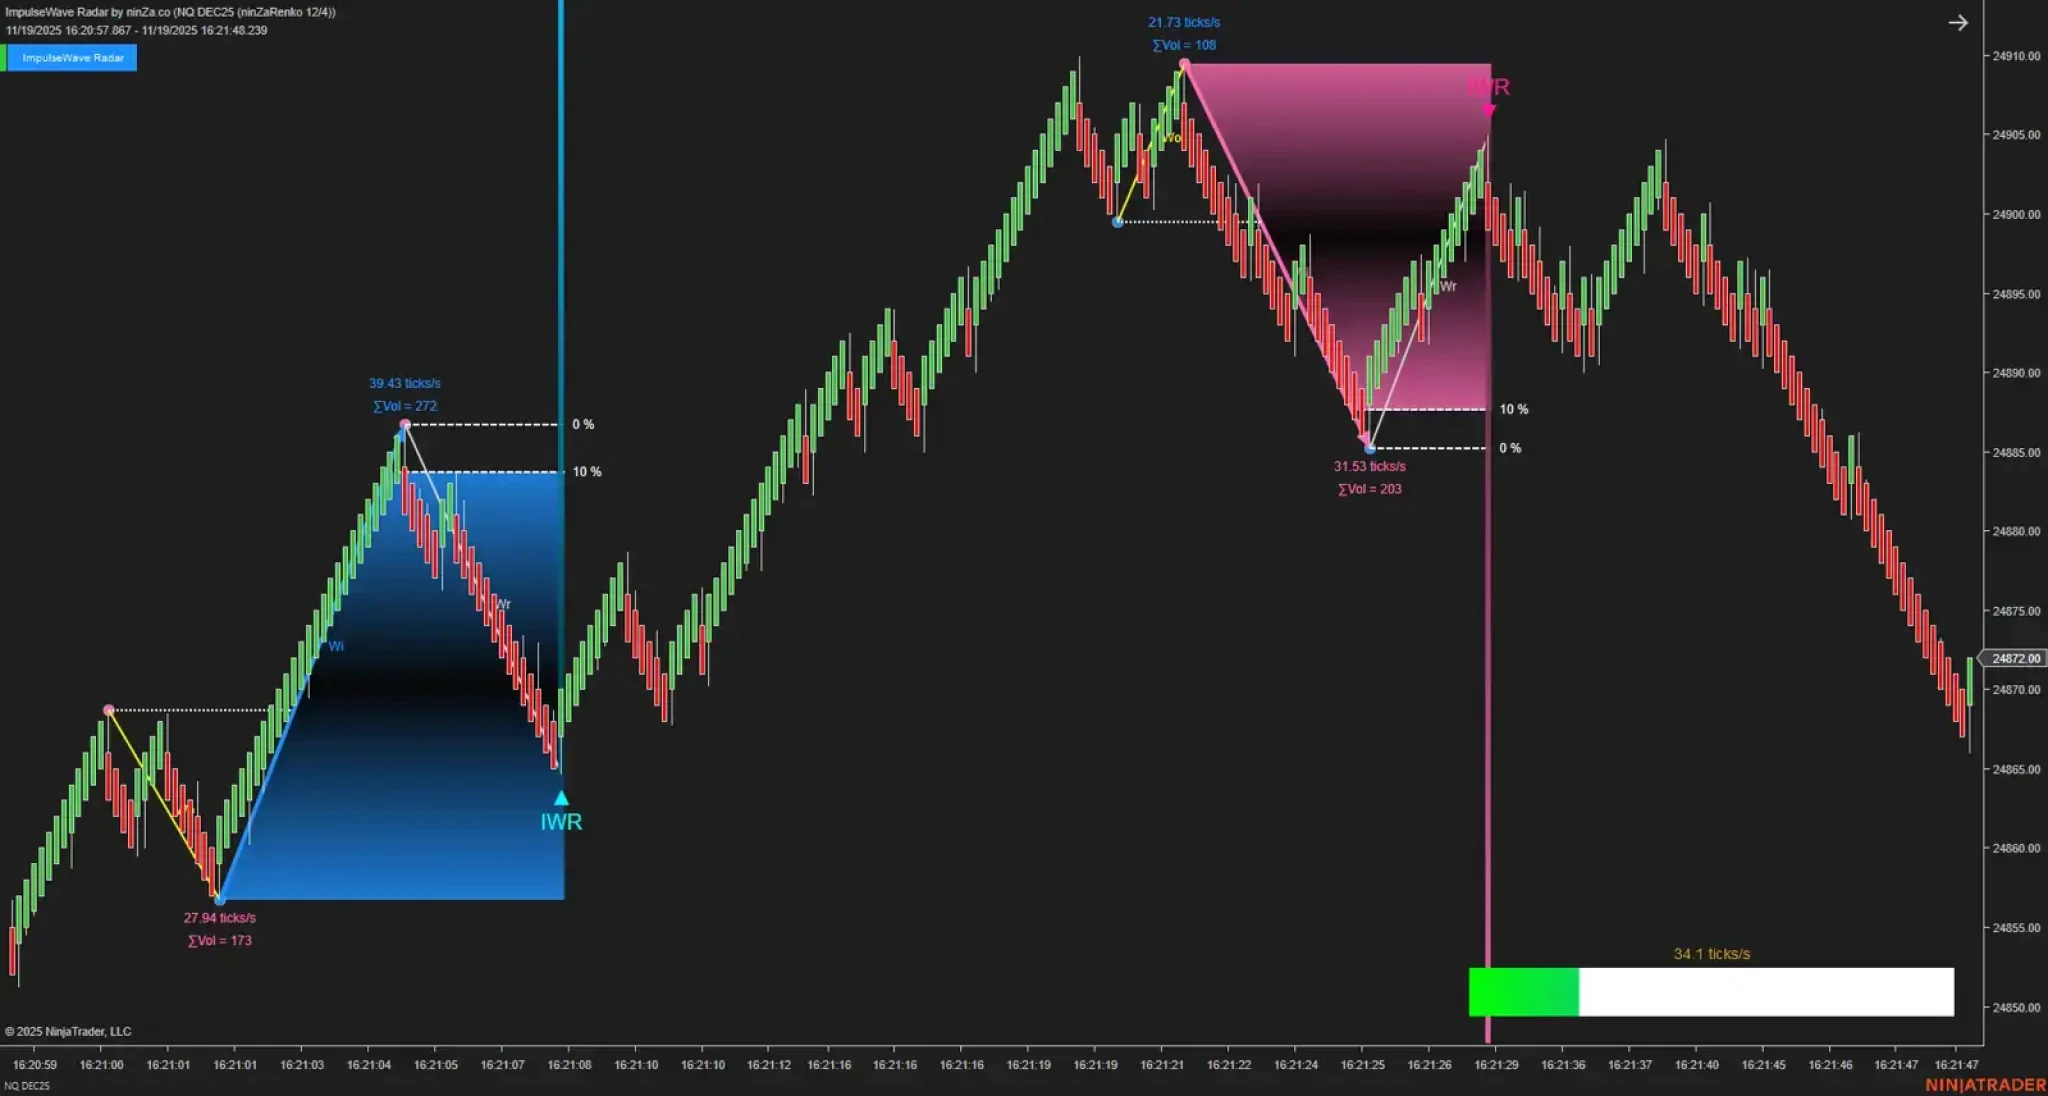
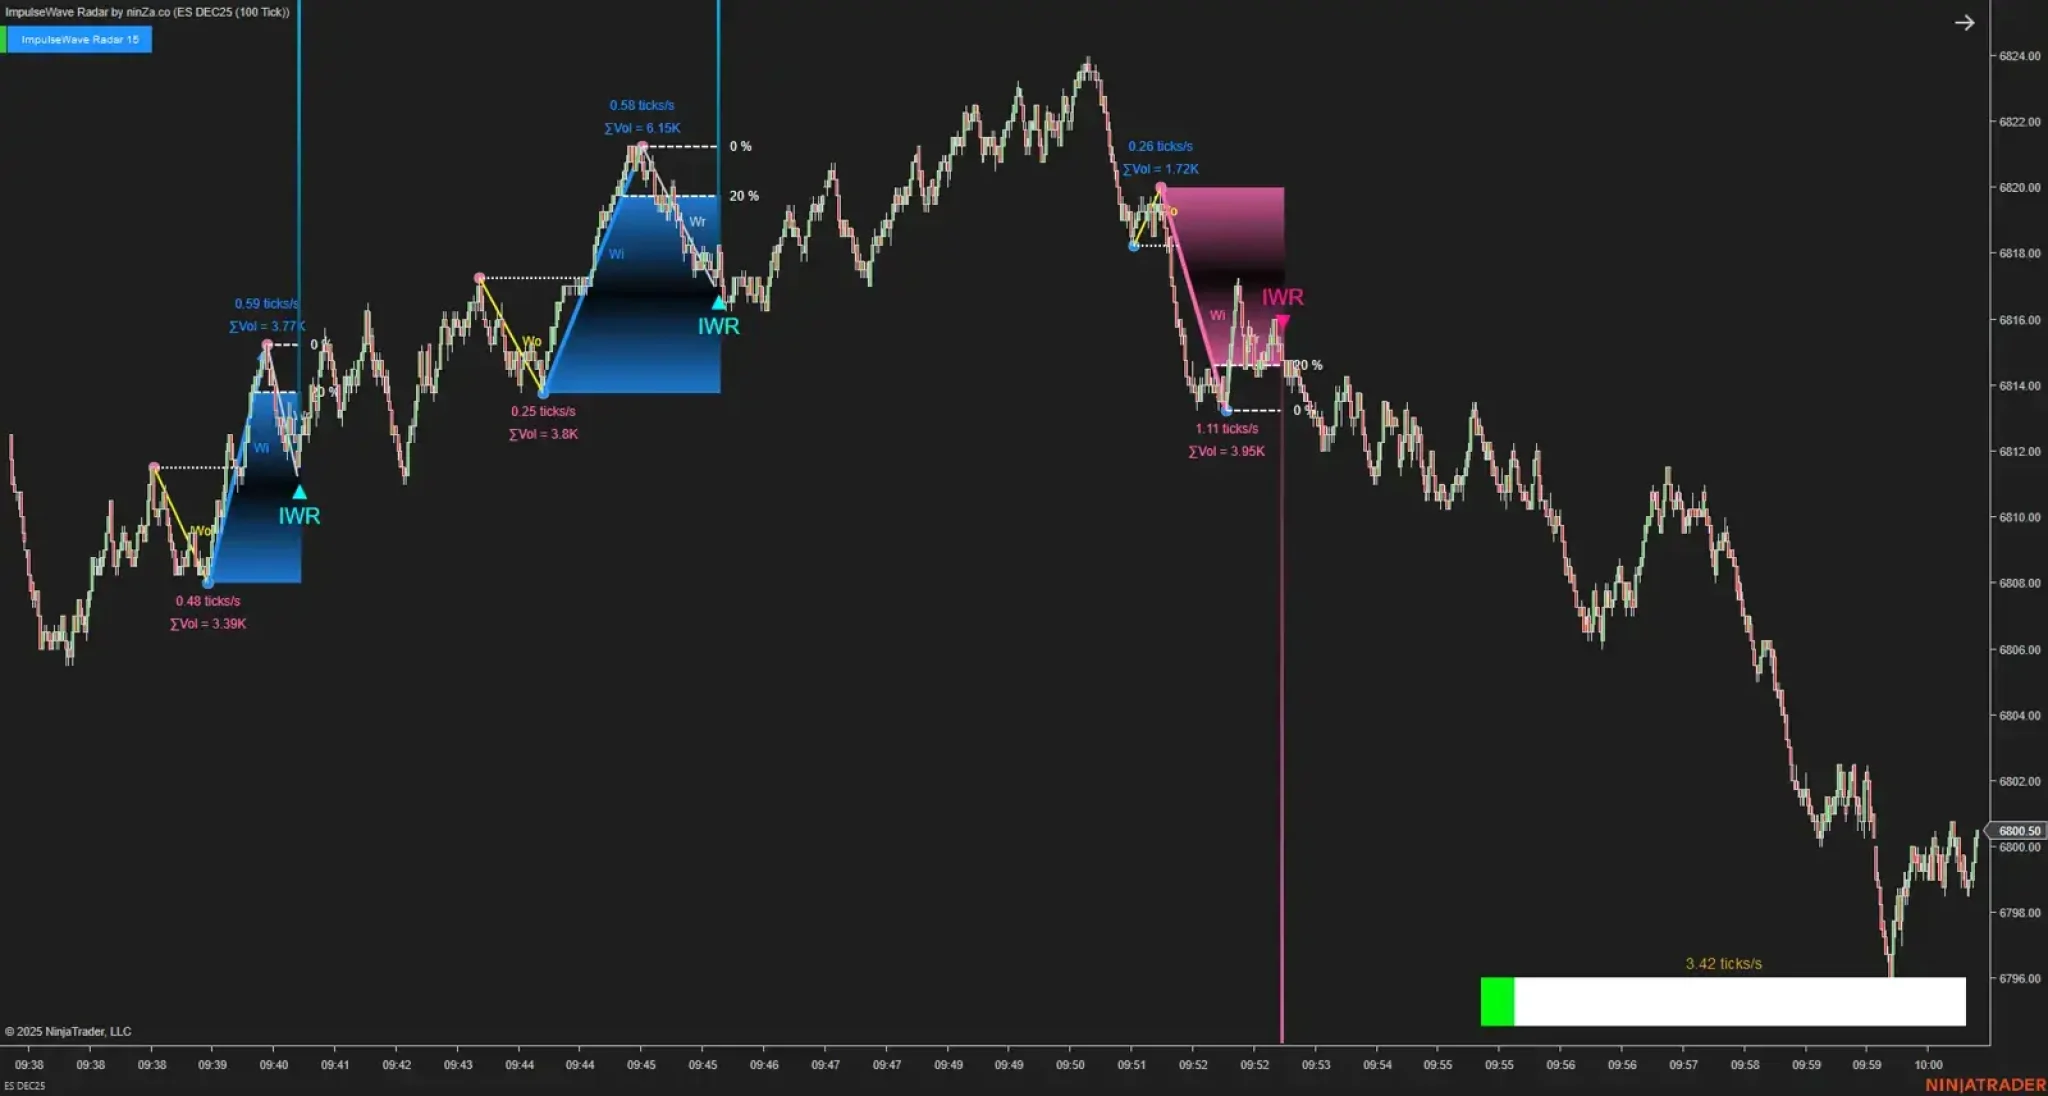
NinjaTrader 8’s Elliott Wave indicator identifies high-probability trading signals by analyzing three consecutive waves:
Base Wave (Wo): The preceding price movement that establishes the market context.
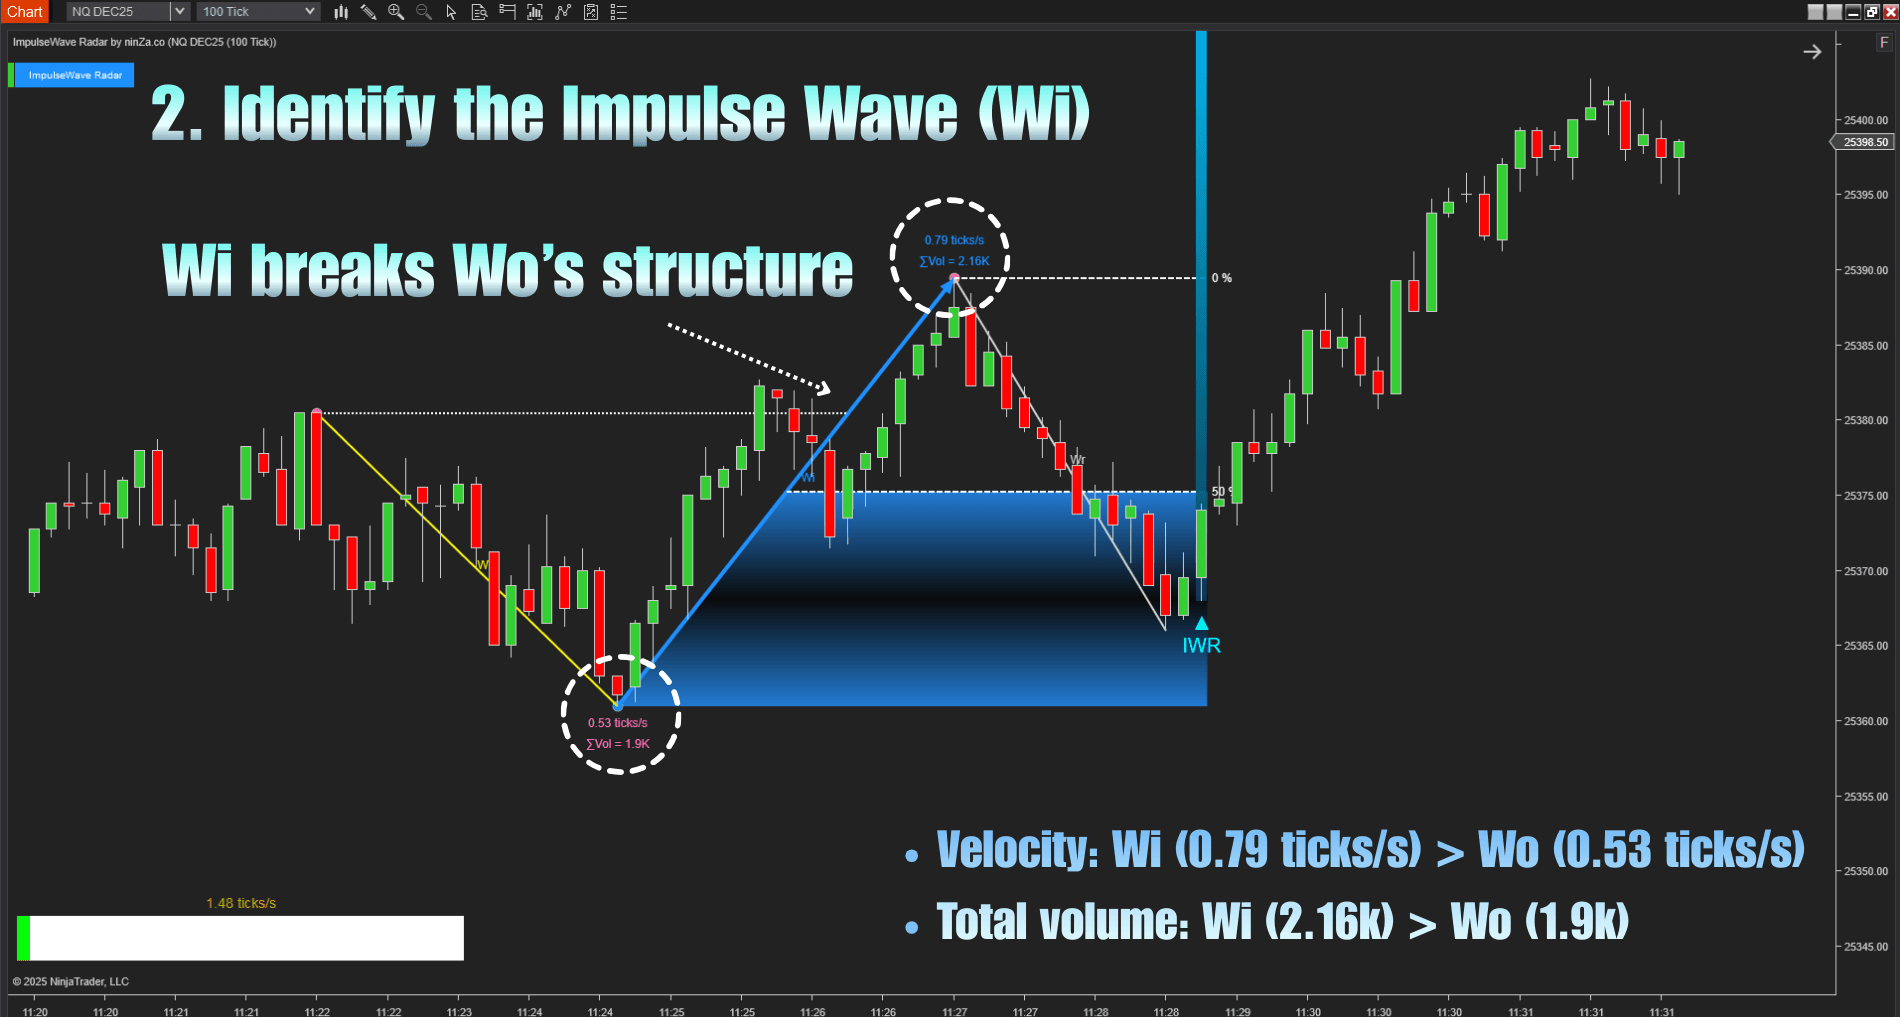
Impulse Wave (Wi): A strong directional move that breaks out of the Wo structure, signaling genuine buying or selling pressure.
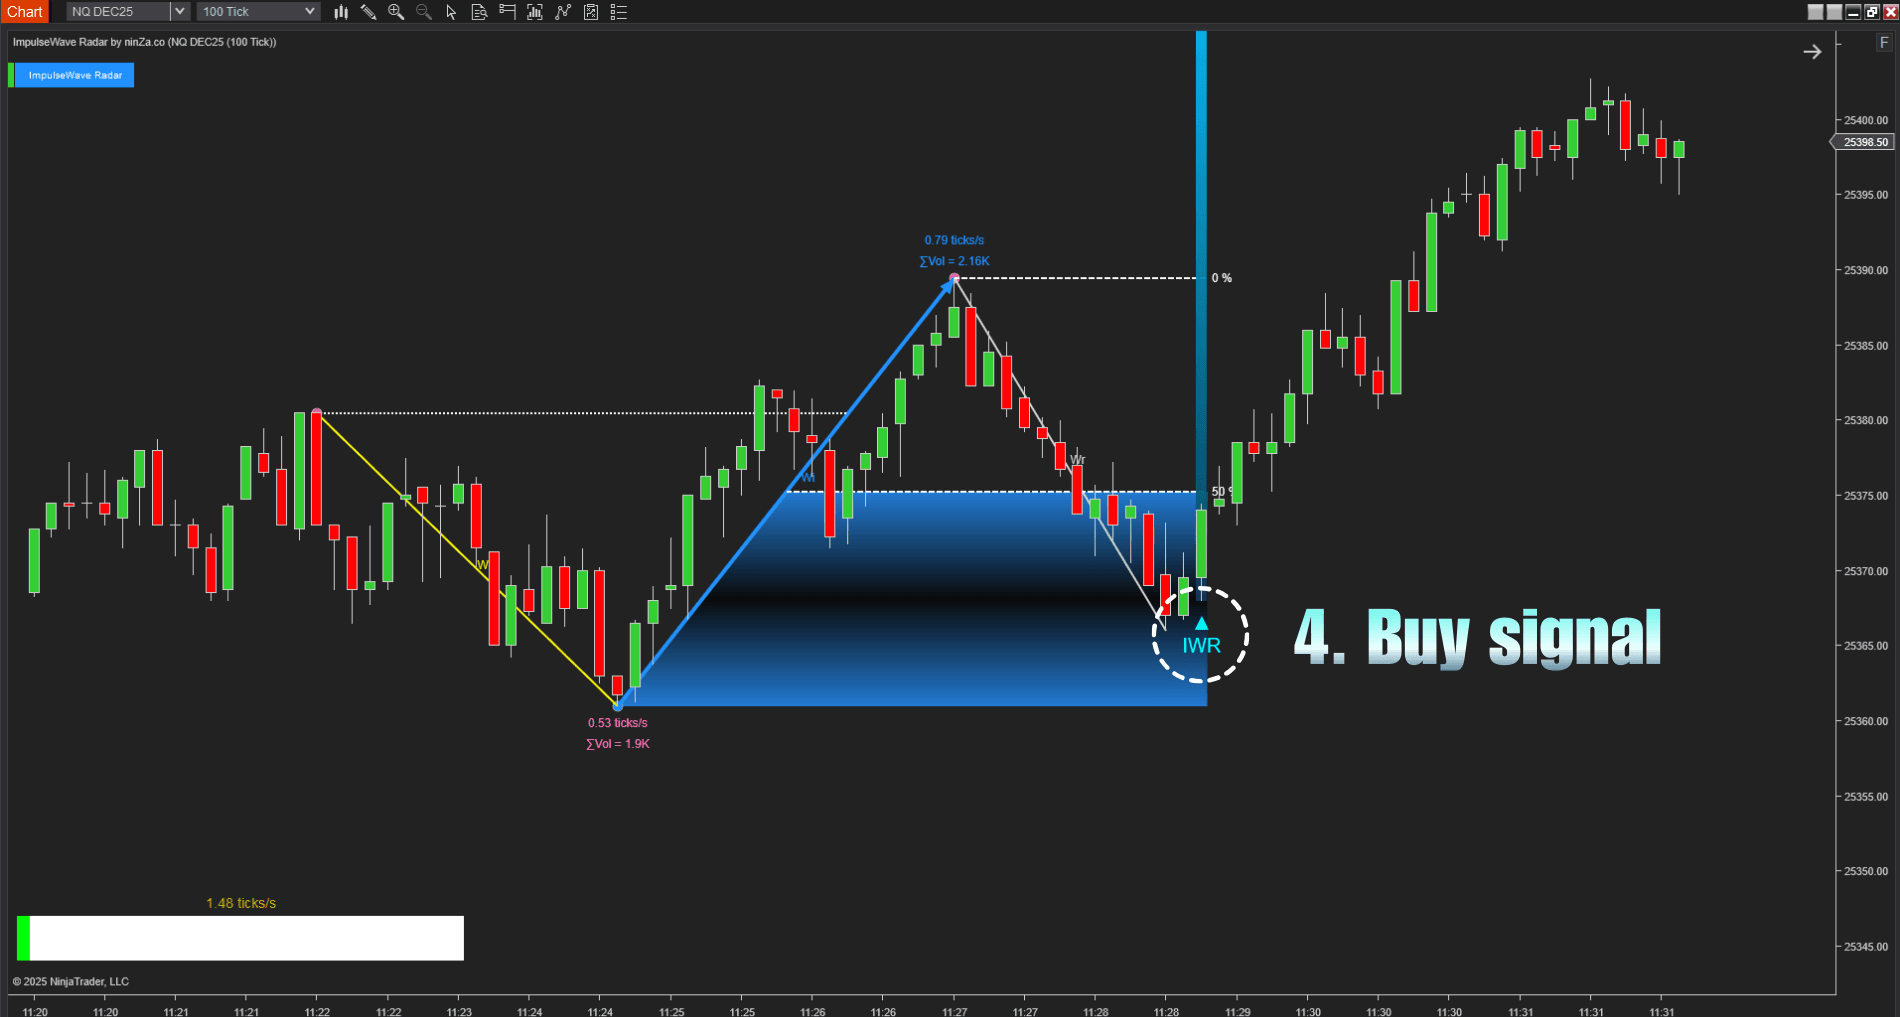
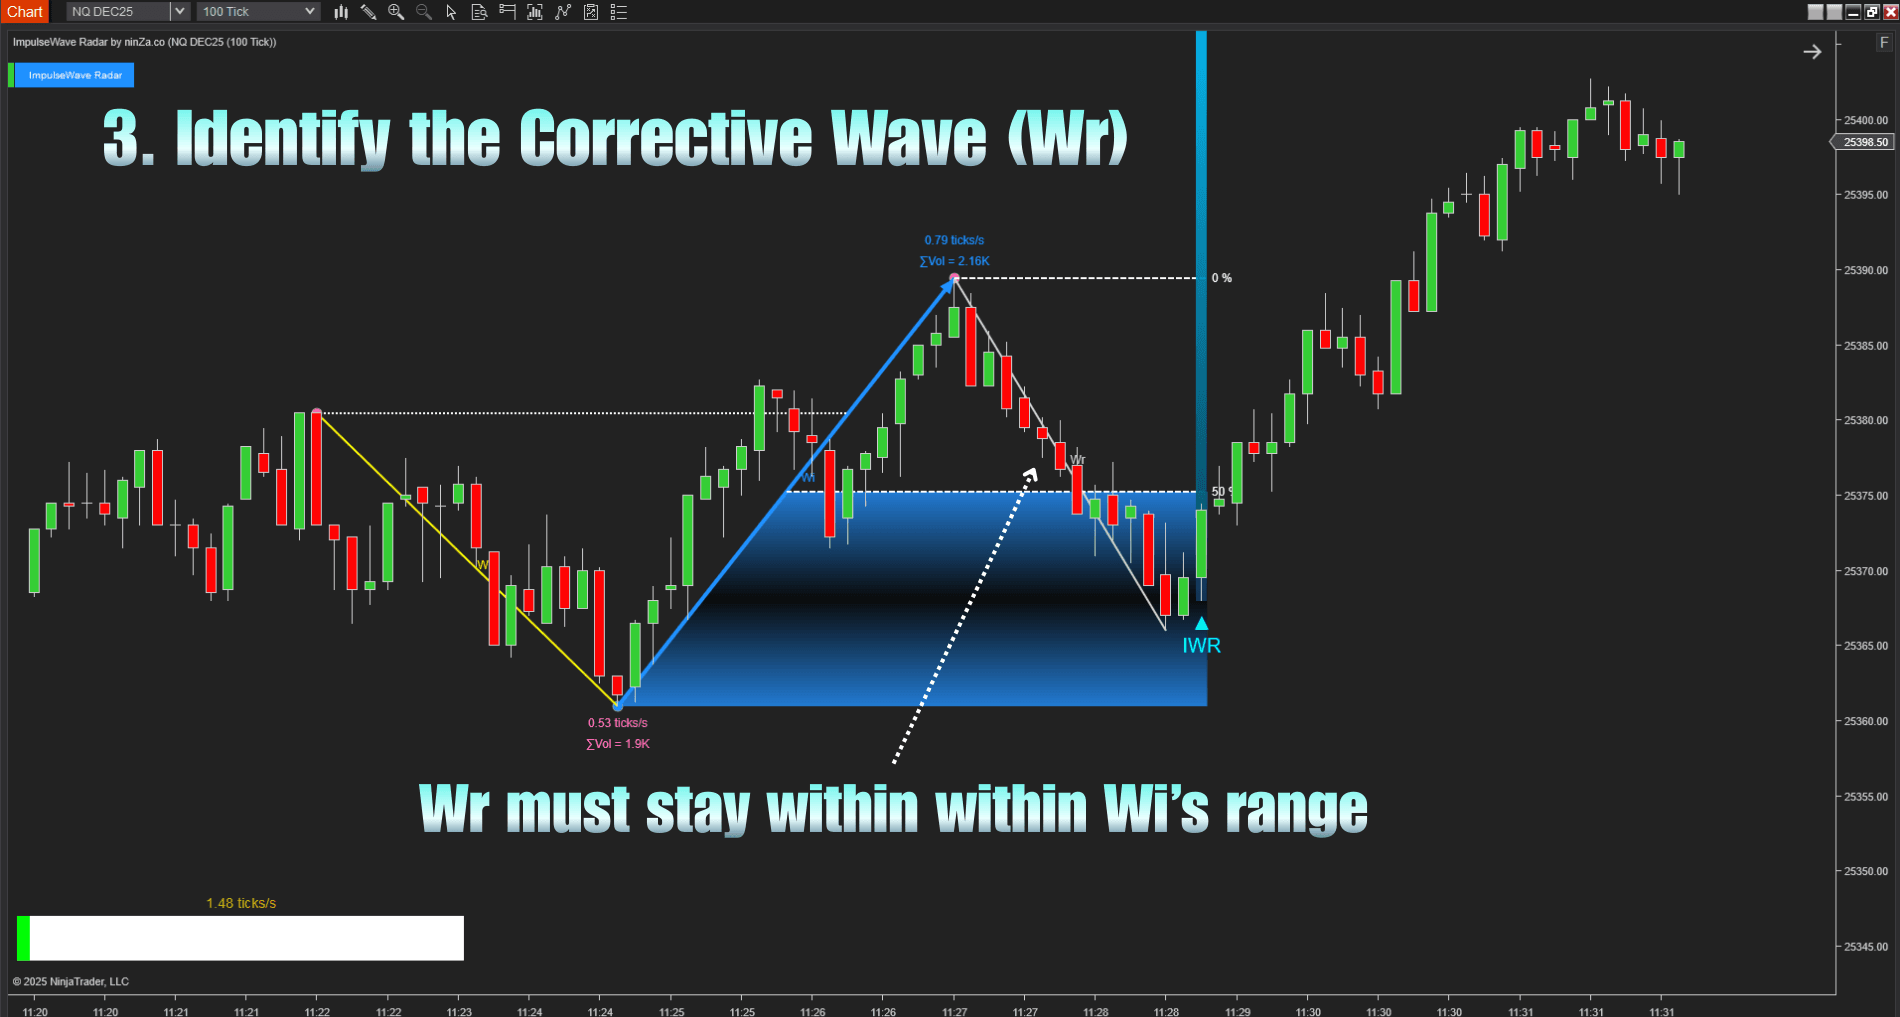
Corrective Wave (Wr): A pullback that remains within the range of Wi, confirming that the momentum of Wi remains intact.
What makes Radar unique?
1. Integration of Trading Speed
The Elliott Wave indicator in NinjaTrader 8 utilizes speed metrics to clearly distinguish between minor price fluctuations (noise) and genuine shifts in momentum. Each impulse wave (Wi) is validated to ensure the presence of strong, decisive buying or selling pressure. Signals occurring during ranging markets or periods of low liquidity are automatically filtered out, allowing you to focus on setups characterized by active market participation.
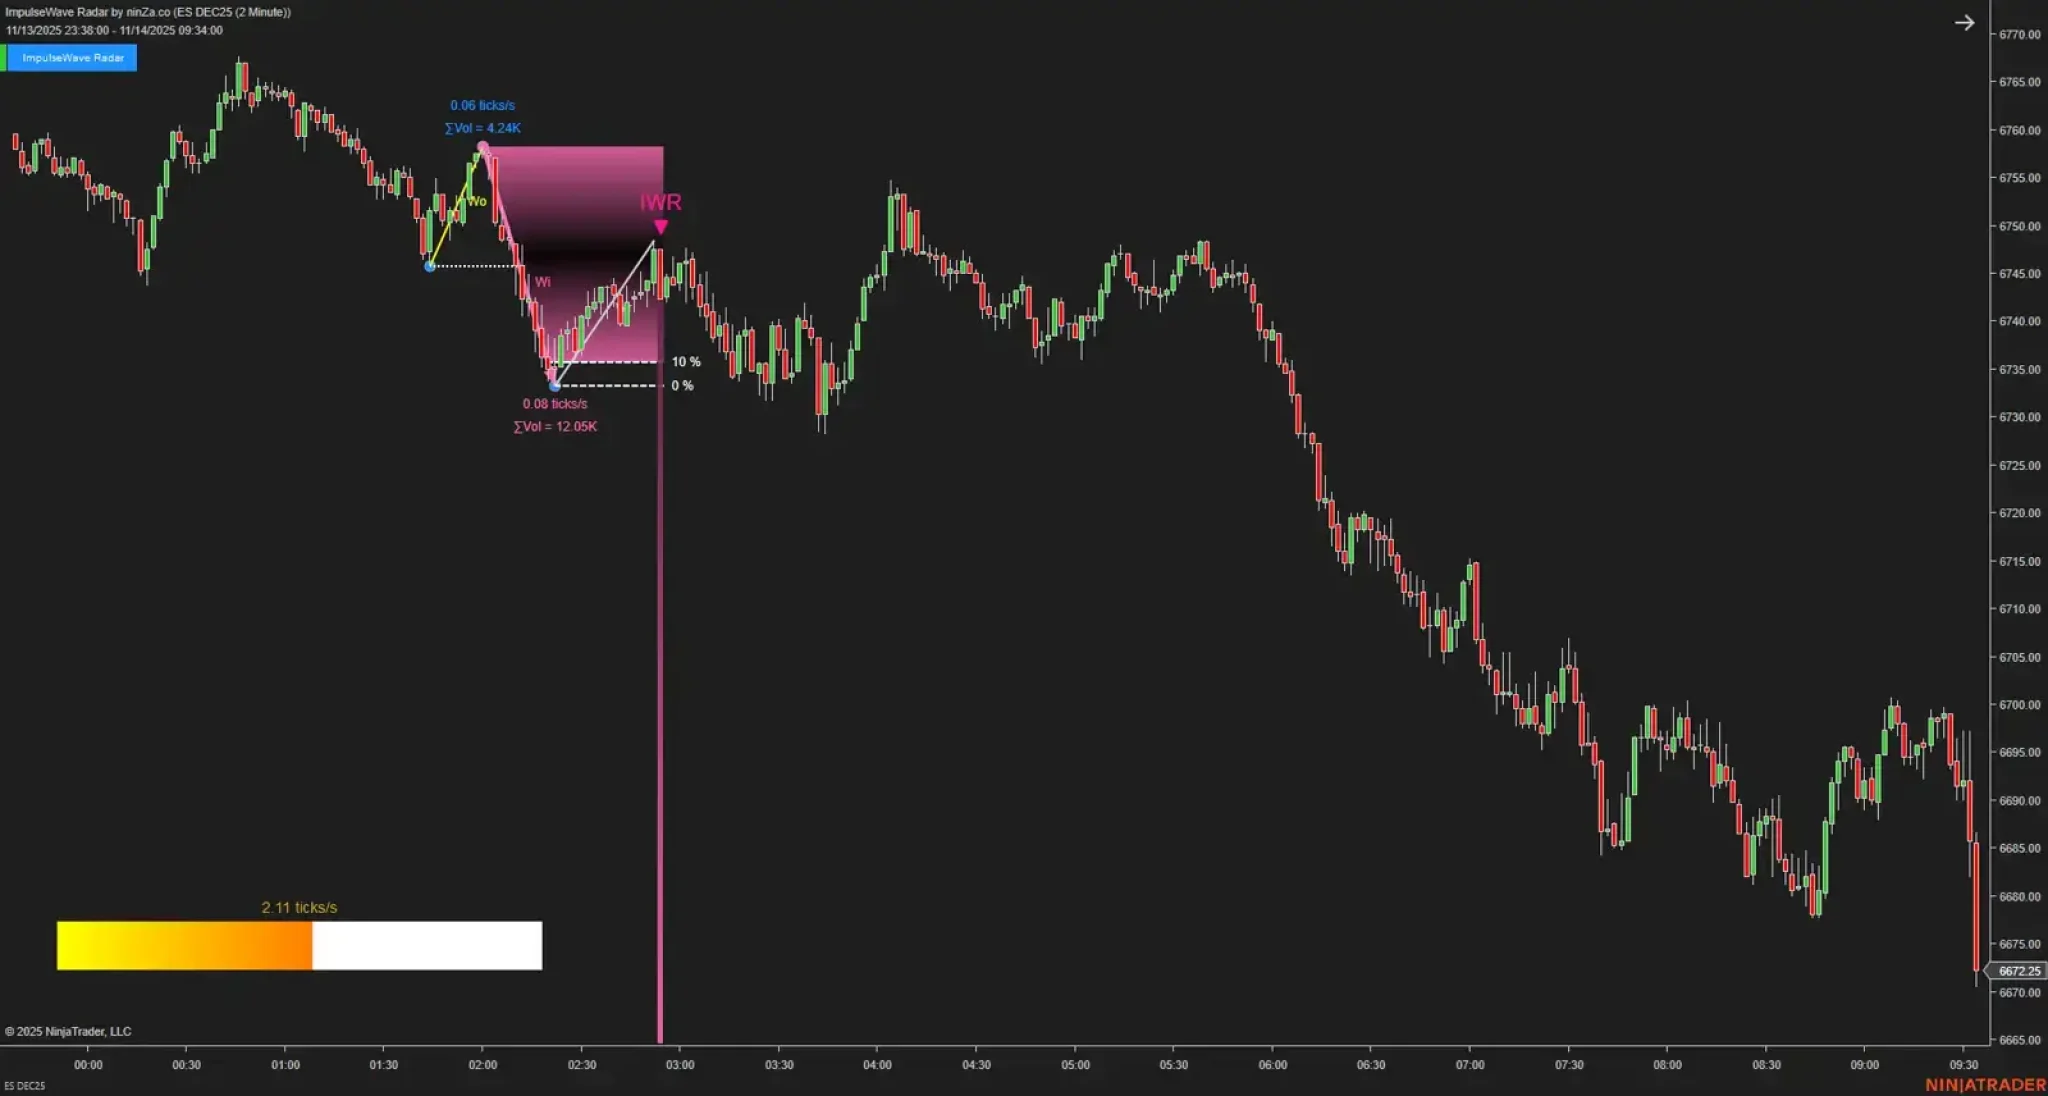
2. Validation of Corrective Wave Volatility
If a corrective wave (Wr) remains within the range of the impulse wave (Wi), it indicates that the initial momentum is being sustained. This pullback is viewed as a temporary retracement, signaling a strong rejection of a return to previous price levels.
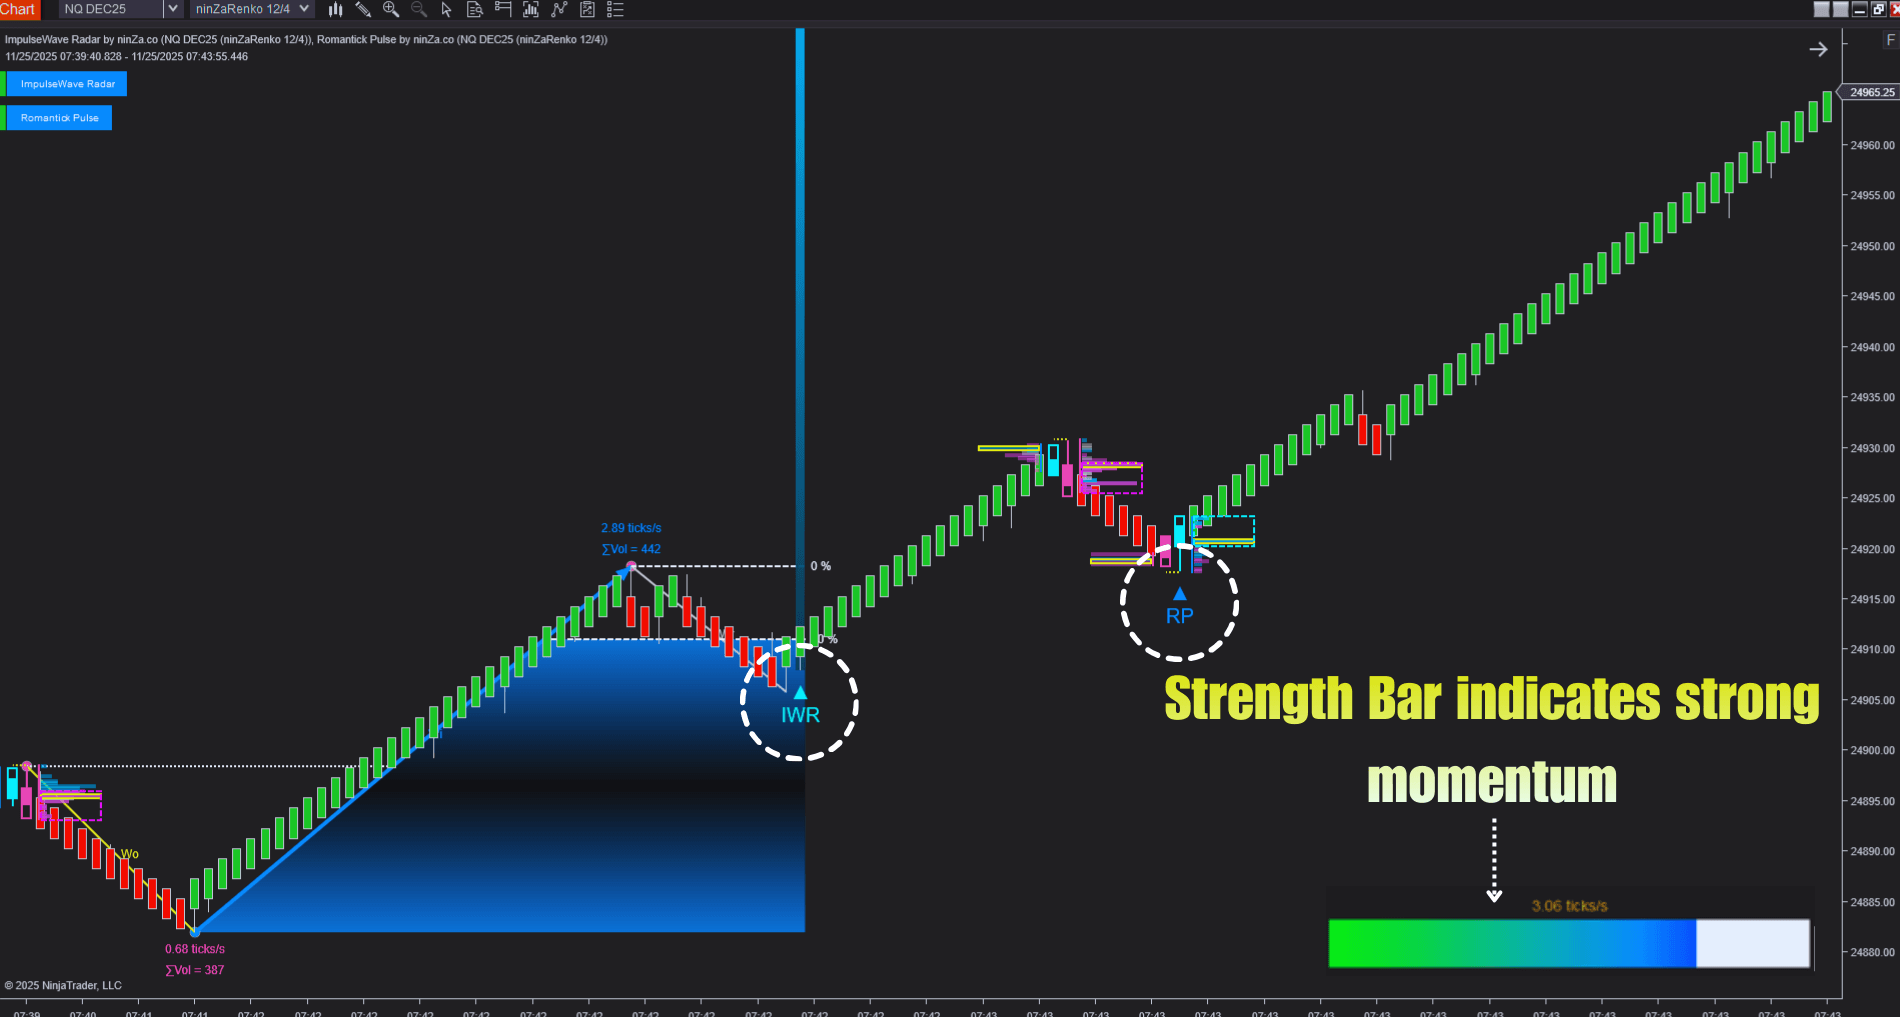
3. Strength Bar
The Strength Bar directly measures the real-time speed of price movement for each candle (changes per second), clearly illustrating the buying and selling pressure driving the market.
It utilizes tick-by-tick data—specifically the frequency of trades or price changes per second—to calculate price velocity, thereby visualizing and quantifying market momentum. Taller bars indicate faster price movement, signifying stronger and more decisive buying or selling pressure.
The indicator also enables traders to identify the current trend at a glance:
Green bars indicate an uptrend.
Yellow bars indicate a downtrend.