Description
What is an ABCD trading pattern?
ABCD trading patterns trend in the market and can be observed on price charts. The sequence of events follows a specific harmonic pattern in the market movement, which helps traders to predict future price movements.
The harmonic patterns of movement can be applied to follow bullish and bearing swings in different market conditions. With us, you can use ABCD pattern trading to speculate on short-term market movements in Forex, indices, commodities and stocks.
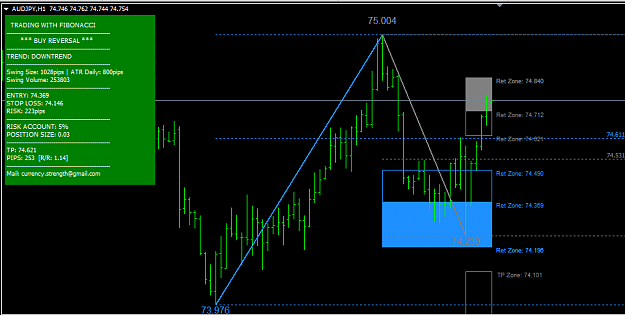
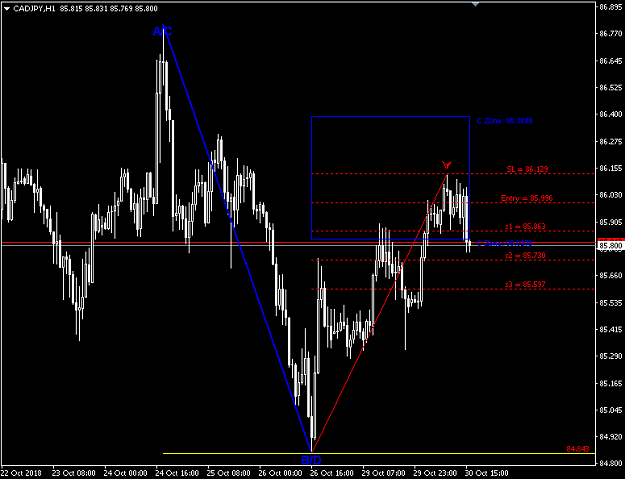
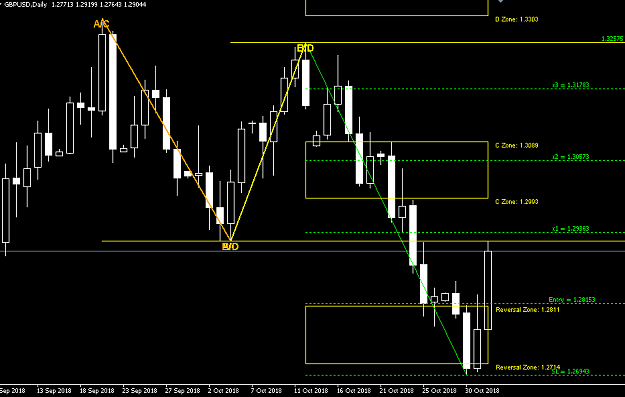
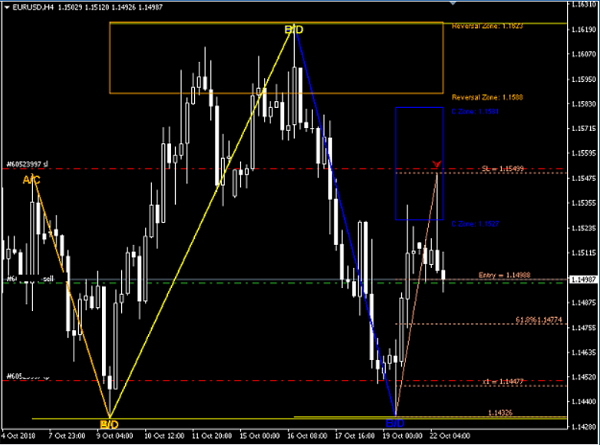
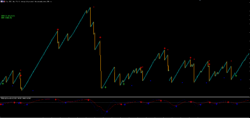
ABCD Auto Detector
This indicator is a powerful tool for identifying.
– Zone C: Correction Zone
– Zone D: ABCD pattern TP
– Reversal Zone: Zone with high probability of reversal trend
The user can choose between
– Aggressive setting: shows many oscillations
– Conservative setting: shows less oscillations
– Manual settings: traders can manually set the sensitivity of the indicator
How to Trade with ABCD Patterns
To trade using ABCD patterns, you must identify indicators, conduct further research, and then set up your trade alerts. Keep in mind that chart patterns develop over different time frames and as part of your research you will need to look at short, medium and long term trading charts.
Before you begin, it is important to note that the pattern can appear on both bullish and bearish trajectories, depending on the trader’s entry point.
Spotting Indicators
Identifying indicators on price charts is the first step in opening a position. Multi-day charts often provide insight into the behavior of stocks and markets over longer periods of time.
You will be able to track previous price ranges and compare them to the volume traded at a given time to zero in on the best entry point. Many traders prefer to focus on “hot” sectors, where there is 24/7 news coverage, peaks and valleys.
Set up trade alerts
You can set up trade alerts to receive notifications when market conditions change from the A segment of the cycle, so you don’t miss out on opportunities to open positions. Remember, you should not rely on signals and alerts to inform you of the progress of your trades – it is your responsibility to monitor your positions.
What is the ABCD trading pattern summarized
The ABCD trading pattern is formed when a stock follows a trend in the market, thus making the harmonic pattern visible on the price chart
You can use this pattern to spot market entry and exit points, whether bearish or bullish
You need to do thorough research and support the ABCD pattern with technical and fundamental analysis
Reviews
There are no reviews yet.