Description
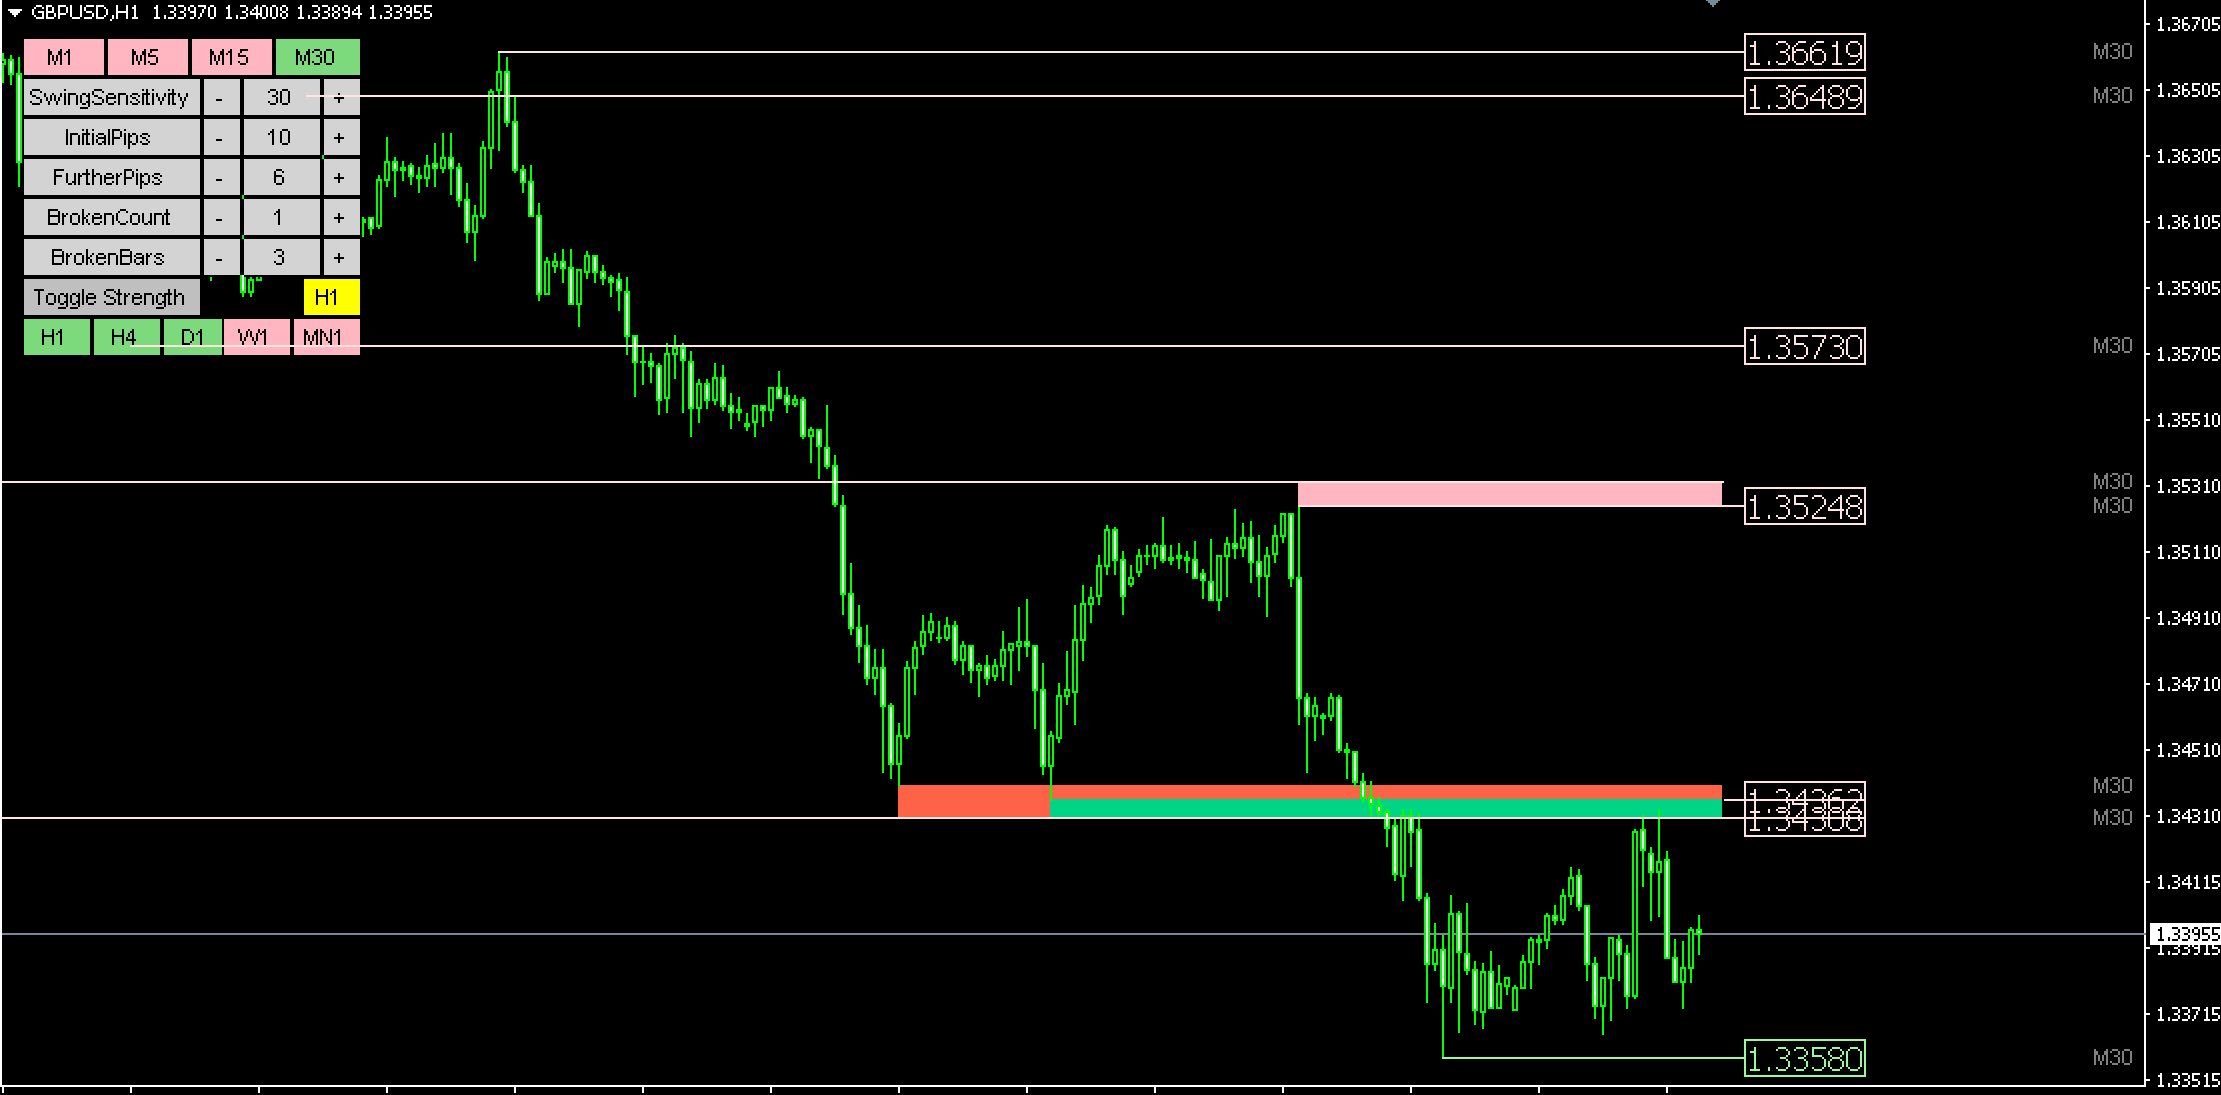
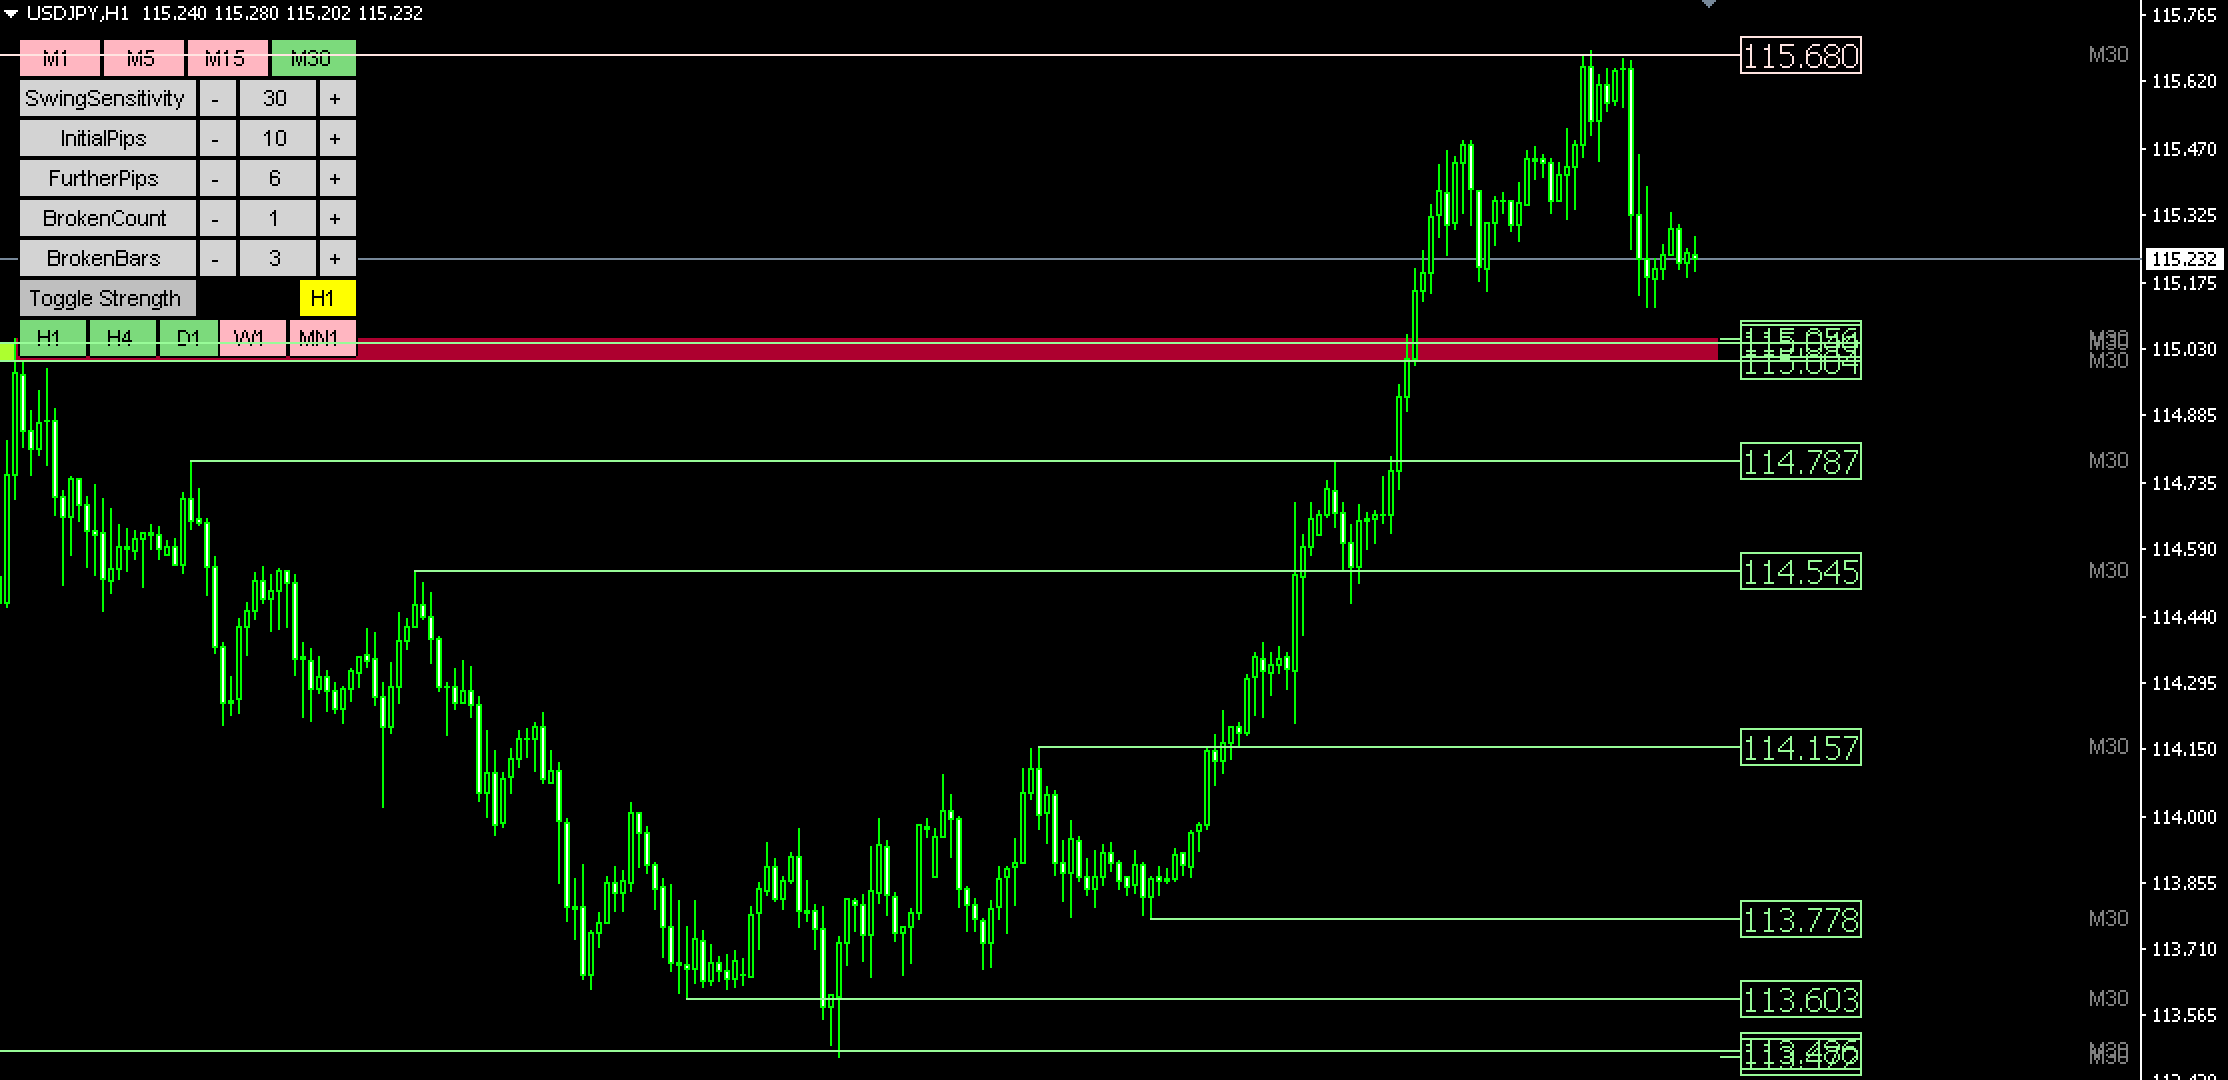
The Advanced Supply Demand Indicator draws the most profitable areas of demand and supply within the MT4 chart.
It will allow you to understand where to look for important resistance and support areas.
This indicator can be described as an MTF. in this case you can add demand and supply areas that are at H1 on the M5 chart.
When the price is in the supply and demand zone, then the indicator will inform the user.
It is important to combine this indicator with a strategy for trading or price behavior to determine the ideal entry point.
It is a great tool for trading trend reversals, trend breakouts and range markets.
This advanced supply demand indicator works with any currency pair and any time frame.
Create demand and supply zones on the charts.
Easy to use, even for complete beginners.
Use strategies, systems or price actions.
You are free to play with the different settings of the indicator inputs to suit your needs and preferences.
Basic Trading Signals
Signals such as those given by the Advanced Supply and Demand Forex Indicator are easy to understand and can be described in the following order
Buy signals. Watch out for buying trades when prices are trending up and prices are pulling towards the demand zone.
Place a stop loss below the supply zone, or apply your preferred stop-loss method.
Take profit when the price is at that demand level (resistance), or apply your own exit strategy.
Sell signals. Watch for trades in the sell zone if the market has been trending downward and the price bounces back up to market demand.
Place a stop loss above the demand zone, or use your preferred stop loss method.
Take profits when the price is at supply levels (support) or you can use your own exit strategy
Currency pairs. Any currency
Customized options include. Variables (minimum candle and time frame, show today’s pivot points draw rectangle, show yesterday’s high and low points) width and style.
Time frames: 1 minute, 5 minutes, 15 minutes, 30 minutes, 1 hour, 4 hours, daily, weekly, monthly
What are supply and demand zones in forex?
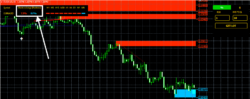
Supply and demand zones (SND) represent the horizontal price accumulation area on the chart where traders hypothetically expect that price change. While resistance or support lines are determined, supply covers many resistance price levels, and demand zone covers several support price levels.
Supply zones (red color on image) are areas on the chart covering active resistance levels where traders usually place sell orders. Demand zones (blue color on the picture) are areas on the chart covering operational support levels where traders usually place buy orders.
advanced supply and demand indicator mt4 MT4 and the Demand-Supply Zones
The demand-supply zones are used to determine the zones in the Forex chart of two currency pairs. When it comes to trading forex through MT4, different colors can indicate these zones. These colored zones indicate the expected price movements to the traders.
For example, let’s assume that there are two colored zones in the MT4. The white color signifies the prices have recently been retracted in the chart. The grey zone covers the prices that are not touched yet. And if the trader understands how to use these zones properly, they can easily make out the Fibonacci retracement among these zones.
Indicators of The Demand and Supply Zones
The demand and supply zone indicators are not difficult to understand, even for beginners. On the contrary, they are easy to use because they are similar to the support and resistance levels. For example, the demand zone is identical to the support level in a price chart. When the price hits this zone, it can move back upwards. The demand zone or the support is also known as the buying zone.
Similarly, the supply is similar to the resistance zone in a price chart. It is the zone from where the price retraces back downwards. This zone indicates the selling signal.
Another vital point to keep in mind while trading forex using MT4 is to check the white and grey zones. The white zone is safe as the price has already been examined in this zone. However, the grey zone signifies the potential price movement and cannot be fully trusted.
How to find supply and demand zones in forex advanced supply and demand indicator mt4?
To find supply and demand zones in forex, you need to draw several support and resistance lines on the chart and determine areas where price has approached many times in the past. Simple, you can download an indicator that draws supply and demand zones on the chart for each time frame.
Are supply and demand the same as support and resistance?
Differences between supply and demand areas and support and resistance levels are only in terminology because supply and demand areas are broader than resistance and support. While support and resistance are price levels, supply and demand zones are price areas. For example, the demand area can have several support levels; the supply area can have several resistance levels.
Reviews
There are no reviews yet.