

Descrição
Grasping trends with smart money flow
Klinger Volume Oscillator Pro is an oscillator specifically developed to spot market trends through a unique combination of price action and money flow (Volume Force). This means you don’t just know if the price is going up or down, but you also understand the true strength behind those movements.

The indicator calculates Volume Force based on a simple principle:
- Price increases accompanied by large volume: Strong upward momentum, money is flowing in.
- Price increases accompanied by low volume: Weak upward momentum, potentially an unsustainable rally.
- Price decreases accompanied by large volume: Strong downward momentum, selling pressure is increasing.
- Price decreases accompanied by low volume: Weak downward momentum, insignificant selling pressure.
It uses the Typical Price (which is the average of the high, low, and closing prices of each candle) combined with Volume Force to create the main signal plot. This gives you a more comprehensive view of price movements and money flow.
What makes Klinger Volume Oscillator Pro special?
More than just a standard oscillator, this Klinger volume oscillator is designed to provide an optimized trading experience with notable features:
1. 2 Flexible trading modes
We understand that every trader has their own unique style. That’s why it offers 2 unique trading modes, allowing you to choose the method that best suits you:
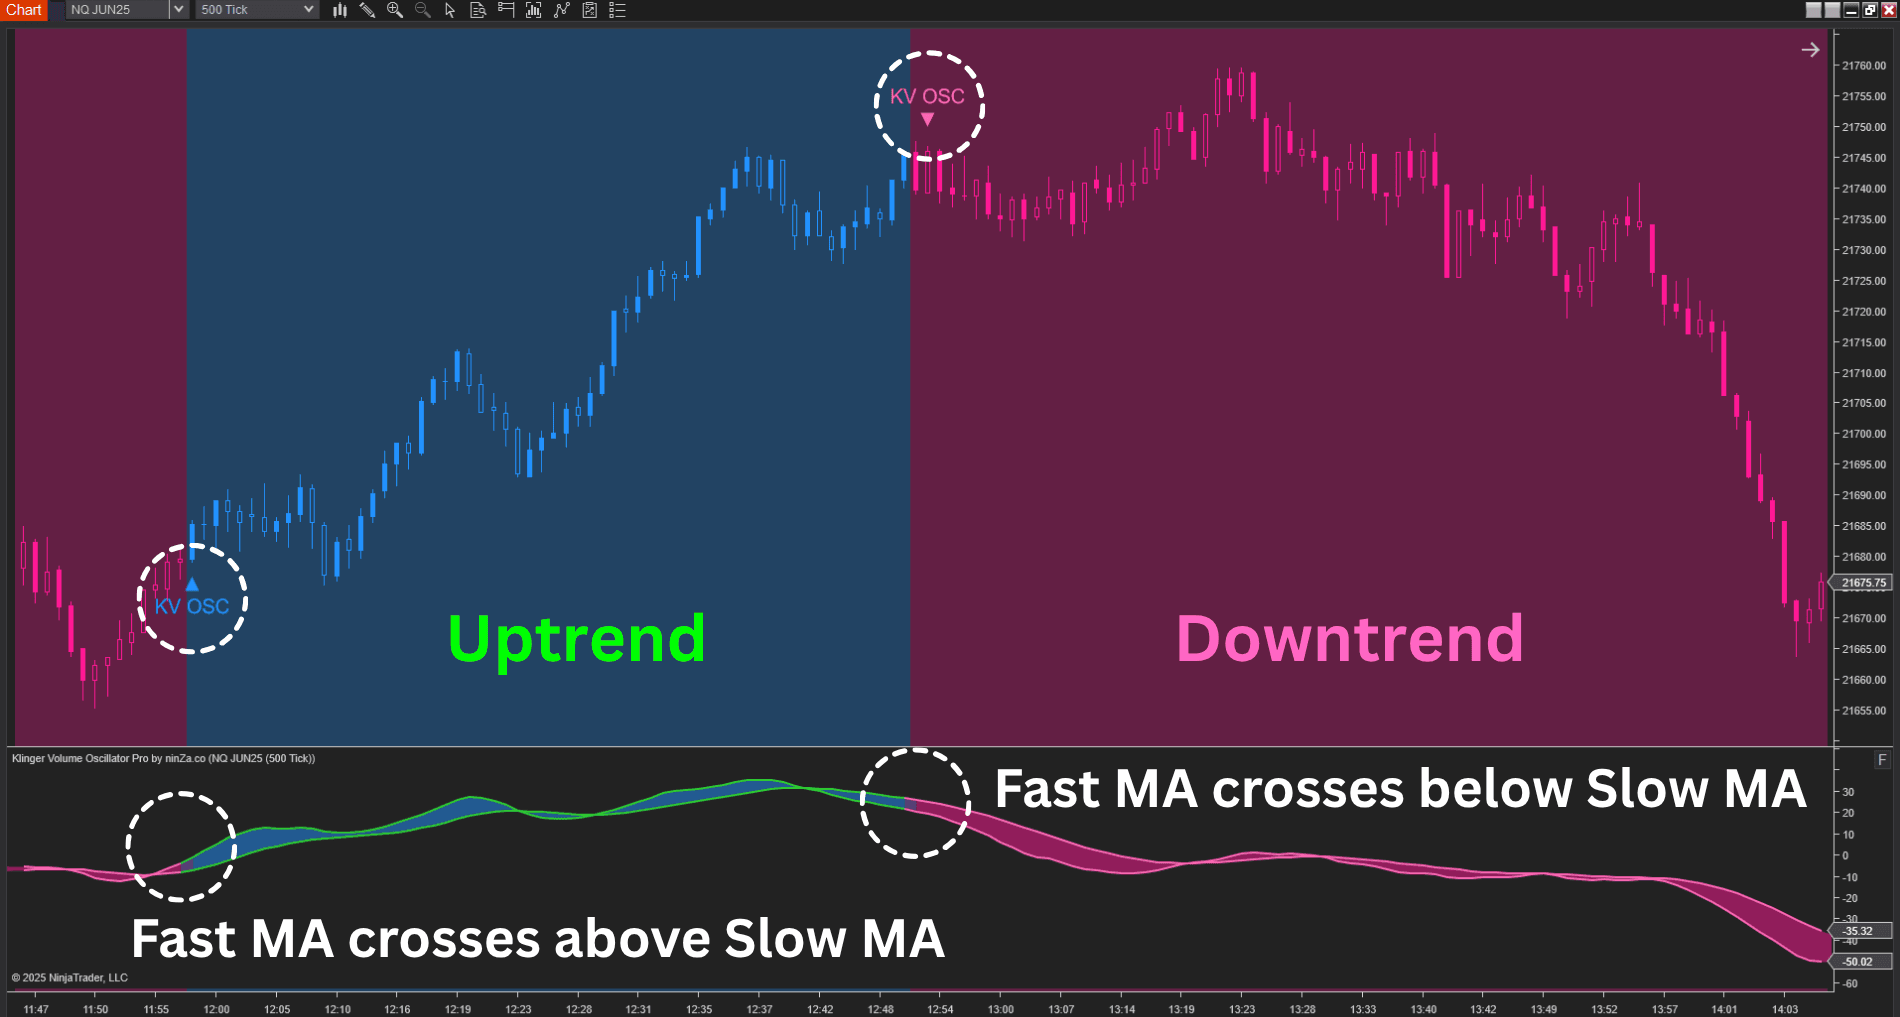
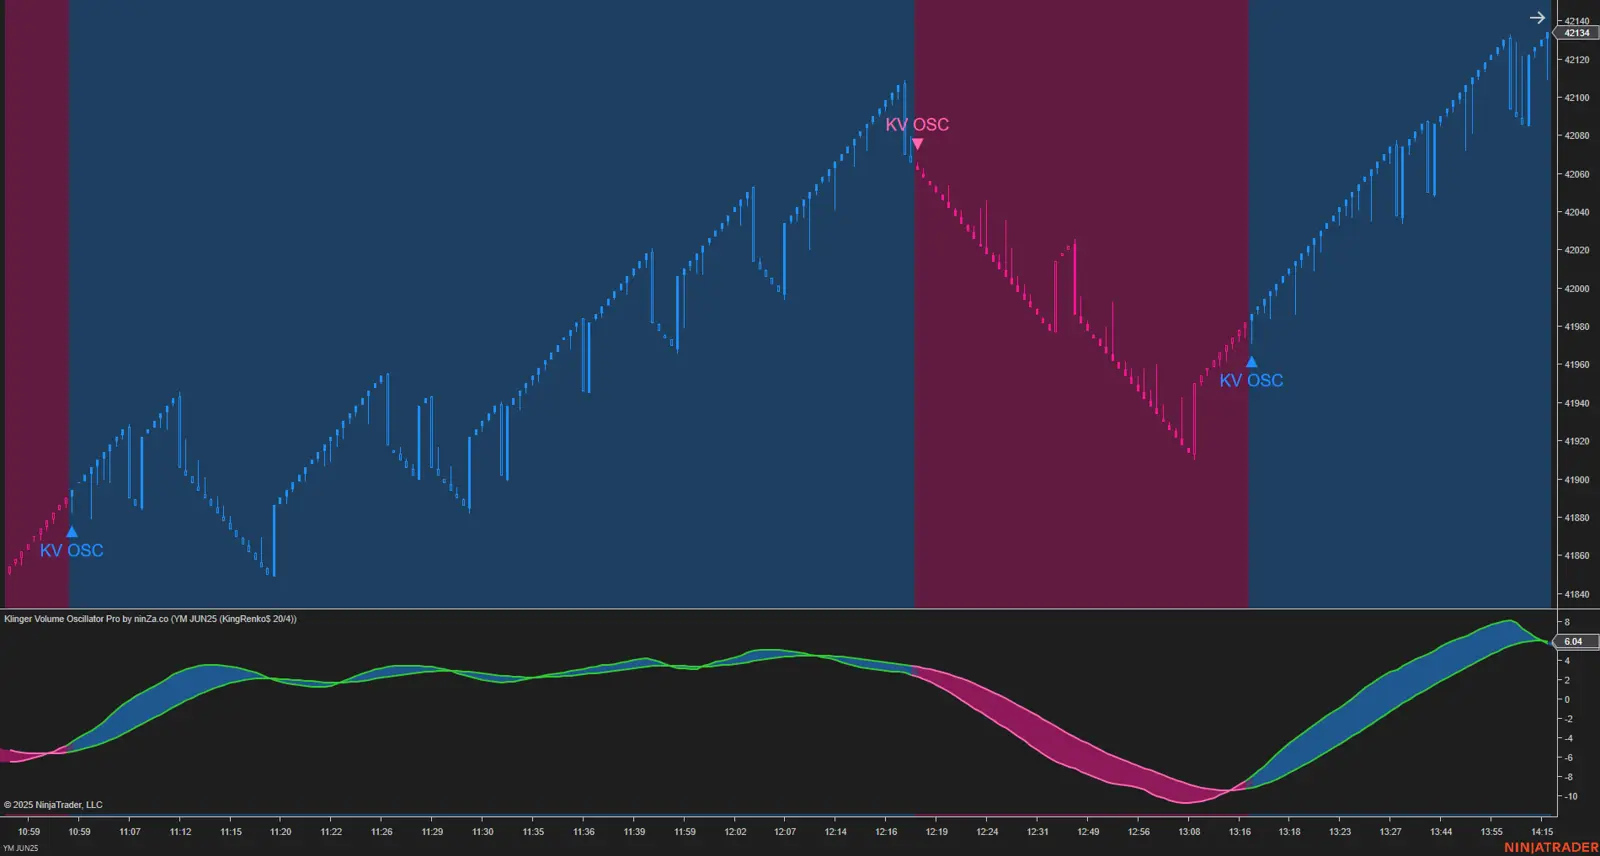
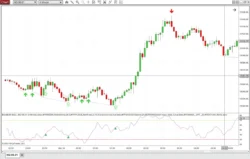
- Plots Crossover Mode: This is a traditional mode, but greatly enhanced. Instead of simply using moving average crossovers, the indicator performs double smoothing through 2 different formulas (Smoothing and Trigger Period). This clearly reduces signal noise in the short term, providing more reliable trend signals, minimizing unnecessary shakes, and helping you focus on the bigger picture.
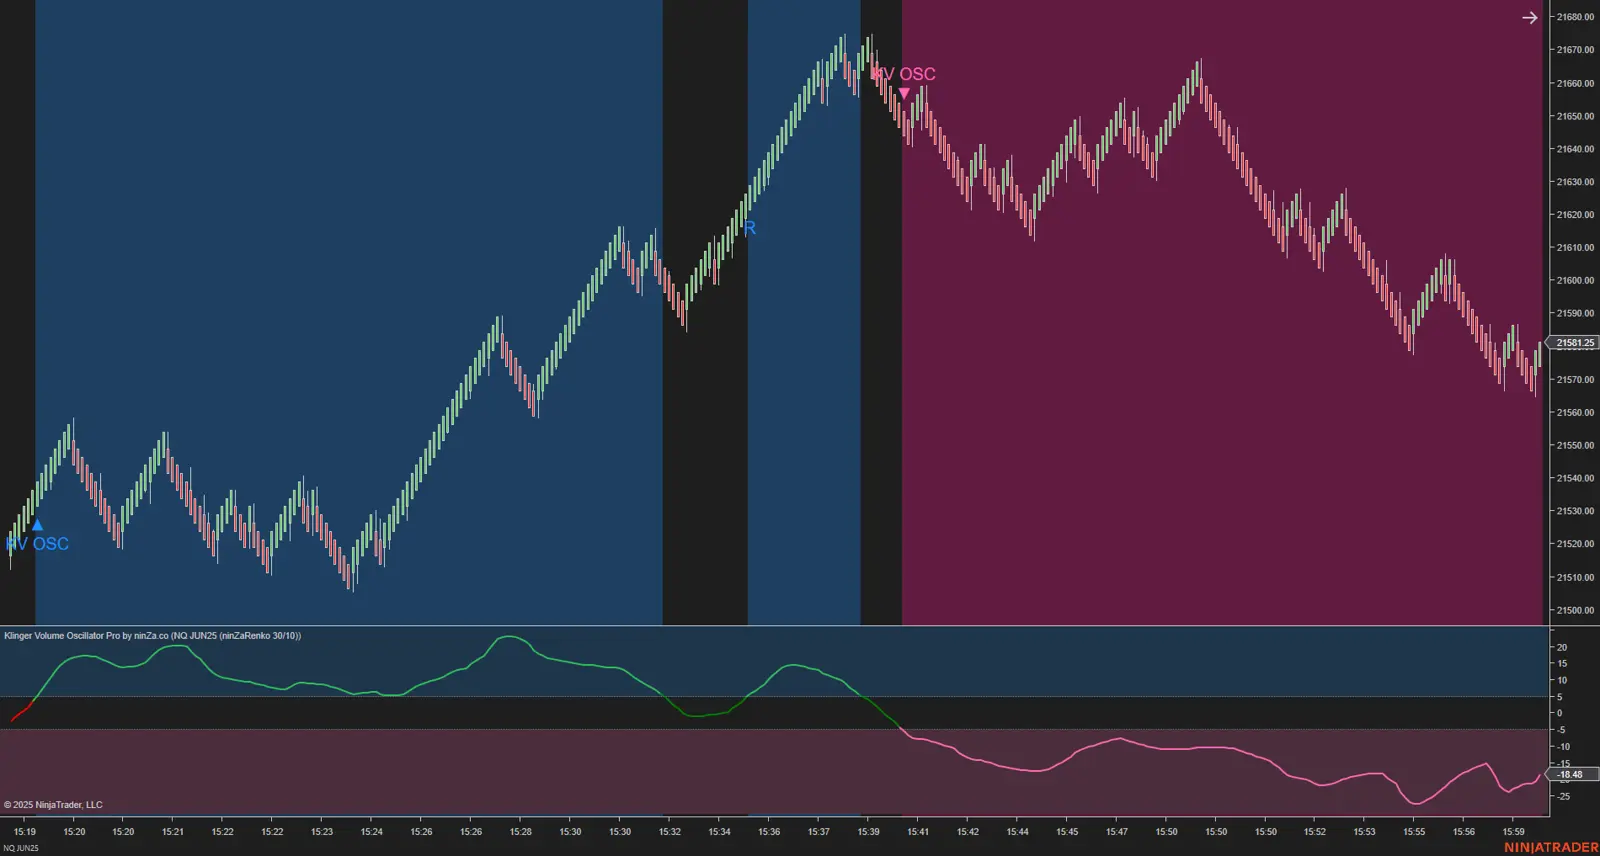
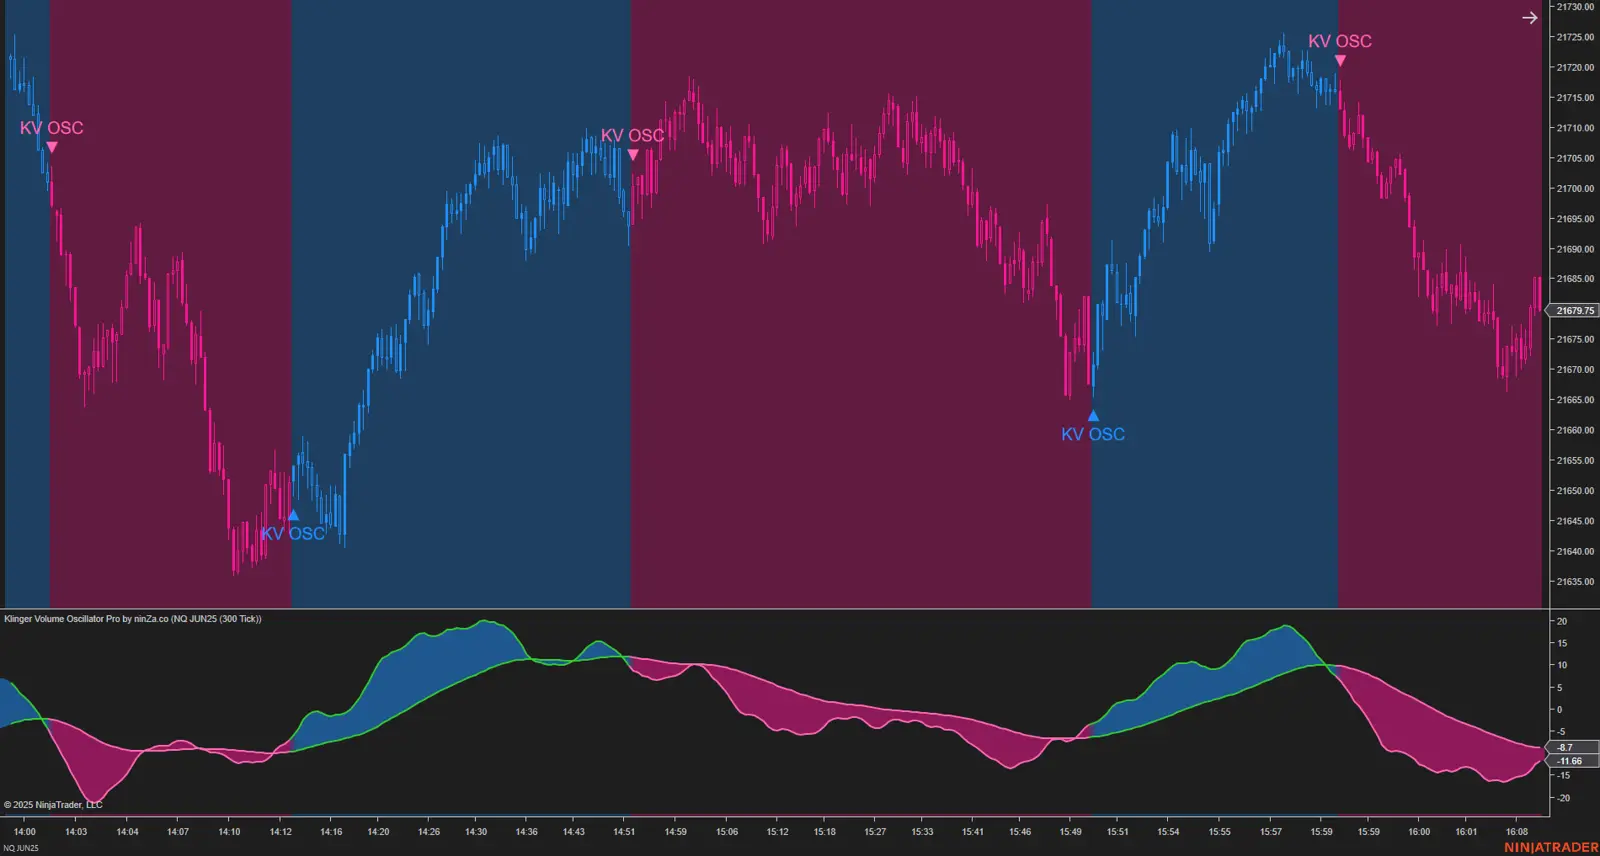
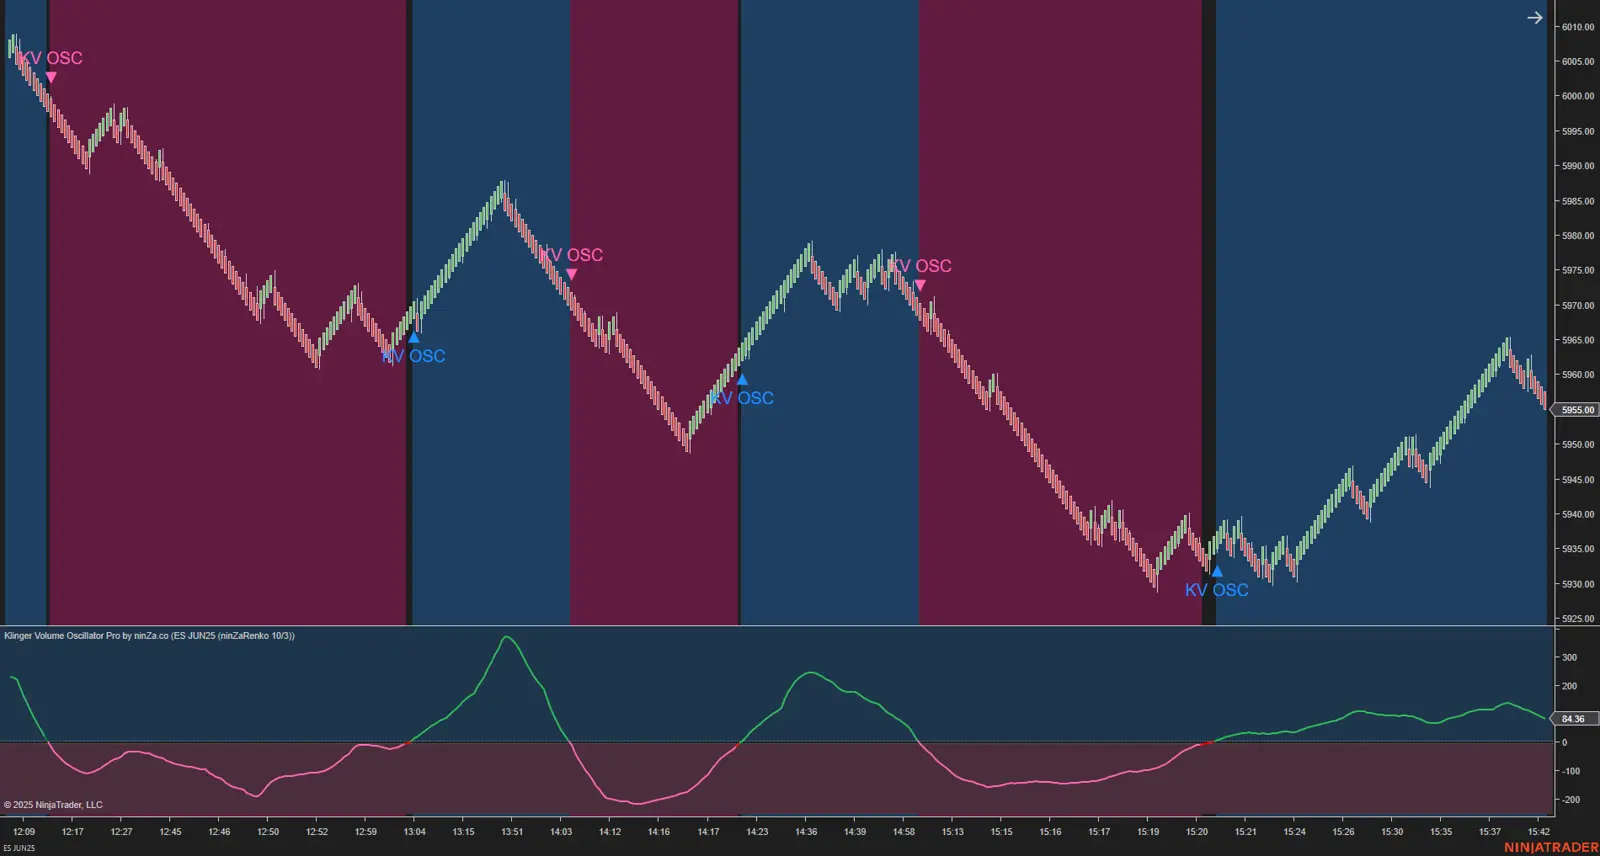
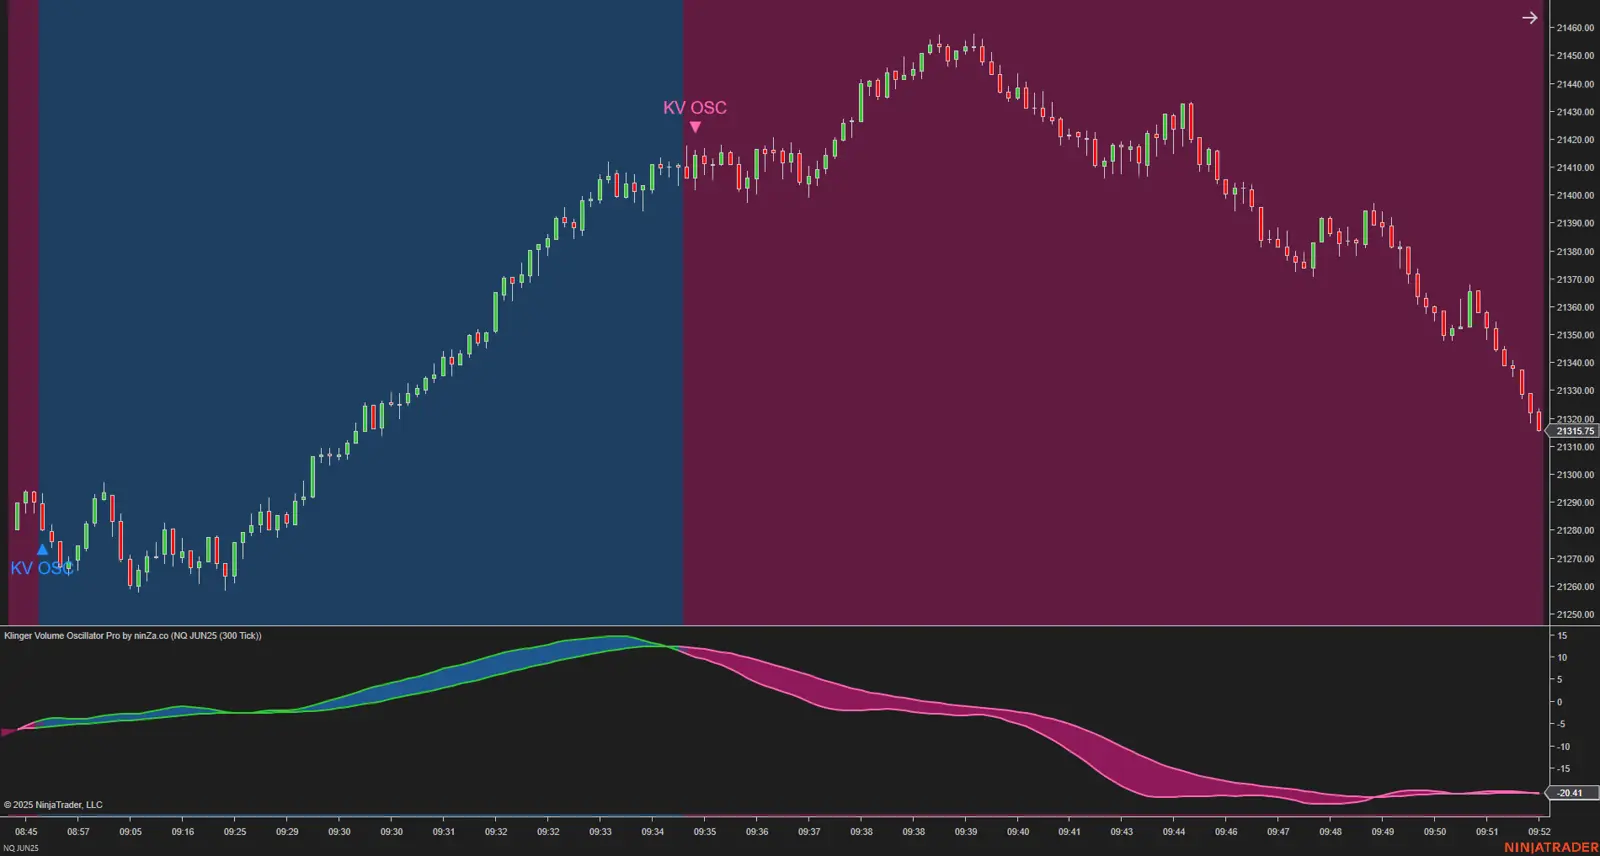
▪ When the fast MA line crosses above the slow MA line, it indicates an uptrend.
▪ When the fast MA line crosses below the slow MA line, it indicates a downtrend.
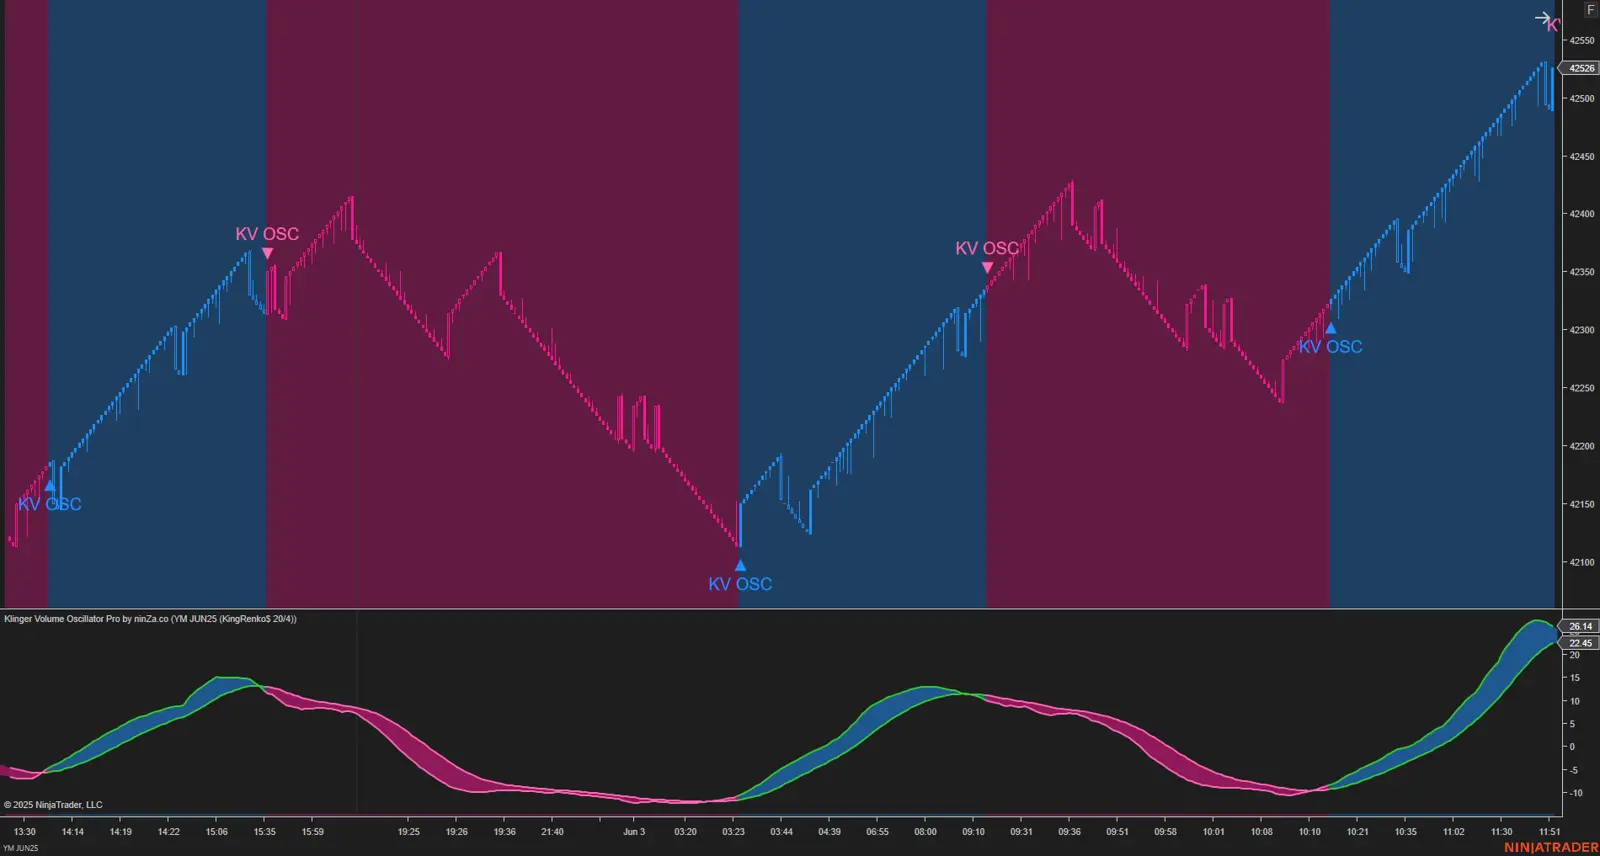
Thanks to the amplification by volume, you can truly observe the market’s underlying momentum, whether it’s strong or weak, by focusing on the MA lines:
▪ When both MA lines are sloping steeply upwards, it means the trend is increasing very rapidly.
▪ Conversely, when the MA lines show signs of slowing down, not increasing strongly, and moving sideways, it’s advisable to limit new entries or consider staying out of the market altogether.