RSI Divergence
What is the Relative Strength Index (RSI)?
The Relative Strength Index (RSI) is a powerful tool that assesses price changes to determine if a market is overbought or oversold. However, traders often face a significant challenge when using this indicator: it rarely reaches extreme levels, making it difficult to generate clear signals.
Introducing RSI Divergence
To address this limitation, traders can look for divergence in the RSI. Divergence can help identify potential market turning points or temporary pullbacks before trend continuation.
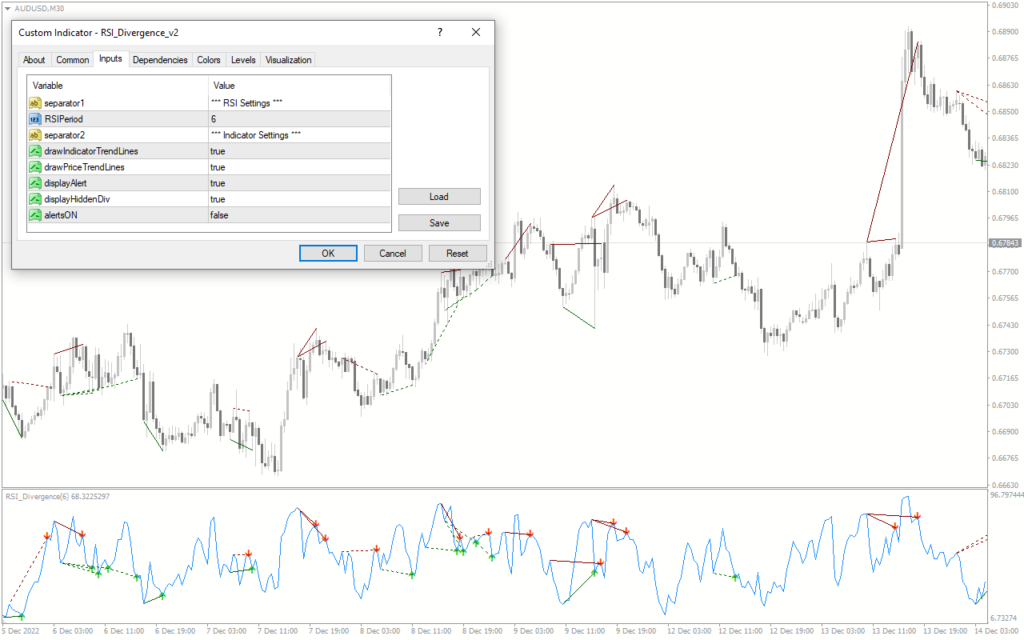
The RSI Divergence Indicator v2
This advanced version of the indicator draws color-coded lines in a separate window on your price chart:
Green lines: Indicate bullish divergence
Red lines: Represent bearish divergence
How RSI Divergence Can Enhance Your Trading
RSI divergence occurs when the indicator moves in the opposite direction of the price over a specific period. For example:
Price makes lower lows
RSI creates higher lows
This type of divergence suggests that the current trend may be weakening, potentially signaling an upcoming price reversal.
Benefits of Using RSI Divergence
Early trend reversal detection: Spot potential market turns before they happen
Confirmation tool: Use in conjunction with other indicators for stronger signals
Trend strength assessment: Gauge the momentum of ongoing trends
Risk management: Identify potential areas to place stop-loss orders
Conclusion
The RSI Divergence Indicator v2 is a valuable tool for traders looking to anticipate market reversals and identify new trending opportunities. By understanding and properly implementing this indicator, you can enhance your trading strategy and potentially improve your decision-making process.