RSI Heatmap Indicator
The heatmap RSI indicator, mt4, helps Forex traders assess the strength of an exchange rate pair. The indicator of currency strength makes use of RSI – Relative strength Index , which accurately determines the strength of a currency. Additionally, they generate a heatmap that contains different currencies and timeframes to track and analyze their meaning efficiently.
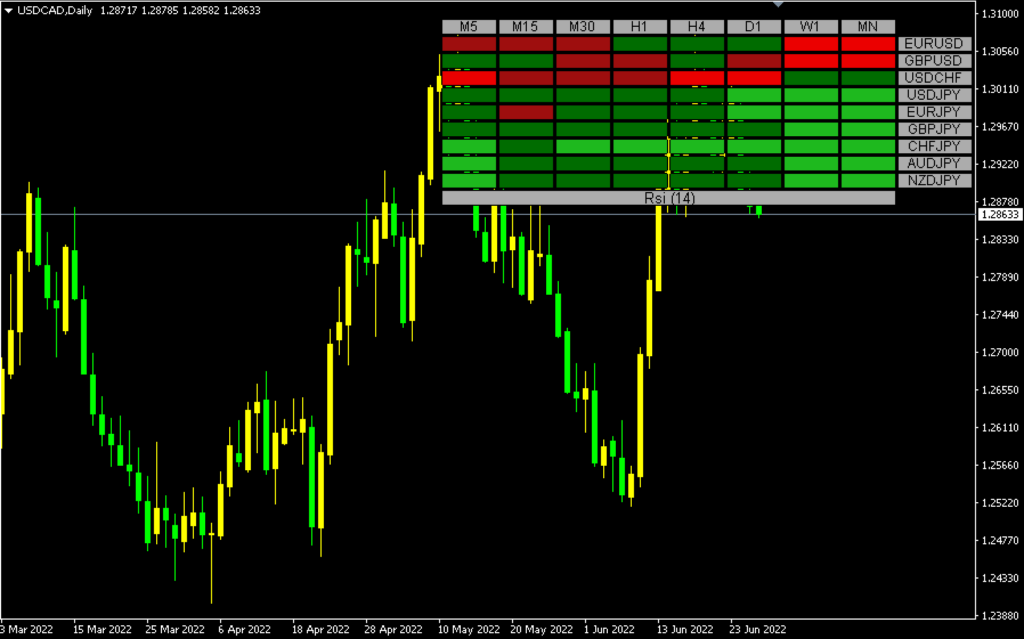
The currency heatmap strength meter has a distinct hue to show the different strengths with precision. Its currency strength map includes four strengths. Based on RSI value and the price movements direction. The different colors help to make traders with a clear picture of the currency’s strength in real-time.
Here are some features that such an indicator might include:
- Color Representation: The heatmap would use colors to represent different RSI levels. For example, green might indicate oversold conditions, red for overbought conditions, and yellow for neutral territory.
- Multiple Timeframes: It might allow users to view RSI values for different timeframes simultaneously, providing a comprehensive picture of the RSI across various intervals.
- Customizable Parameters: Traders might be able to customize the indicator by adjusting parameters such as the RSI period, color scheme, and timeframe settings.
- Alerts: Some heatmap indicators include alert features that notify traders when RSI values reach certain levels, helping them identify potential trading opportunities.

How do I trade forex with the RSI Currency Strength Indicator Heatmap?
When a currency is moving up, forex traders may make an buy order if the hue of the heatmap shifts between Green and then Lime green. Since, this colour change is a sign of how strong the currency increased in strength from weak.
However, traders can also place the sell order whenever the color shifts between Fire Brick to Red.
Traders may make an purchase order when the strength of the signal fluctuates between Green or Lime Green across multiple time frames. In turn, the change in color across time frames can be interpreted as a strong signal. In contrast, the reverse applies to the order to sell. order.
The traders can also list all pairs of fx that use one common currency in order to assess the strength of a currency. For instance, traders could show all forex pairs using GBP in order to recognize and track the power of GBP.
Conclusion:
The the forex strength gauge is an incredible MetaTrader 4 indicator. It’s very helpful, particularly for traders who use the strength of currencies as an element of their trading strategy. Furthermore the use of RSI to assess the strength of a currency pair will increase this indicator’s precision.