TDI indicator MT4

The Trader Dynamics Index indicator combines several indicators. Using the TDI RT Alert Divergence, traders can view the market from several perspectives. It helps to determine the direction and strength of trends, as well as the volatility of the market.
This guide will explain more about the TDI RT Alert Divergence indicator and how to use it in your trading strategy.
What is the TDI indicator and how to use it?
The TDI was a pioneering indicator when it arrived in 2005. Dean Malone created the Trader Dynamics Index to monitor market conditions and to detect trading signals.
The RSI indicator is the basis of the TDI. It determines the strength of the current trend and the extent of price changes. Moving averages and Bollinger bands are used to smooth the lines. This combined approach allows the TDI RT Alert Divergence indicator to be used as a complete trading system on its own.
The indicator shows both the speed and direction of the current trend, which allows traders to choose the right time to trade. The operation of the indicator is easy to understand, despite its complexity.
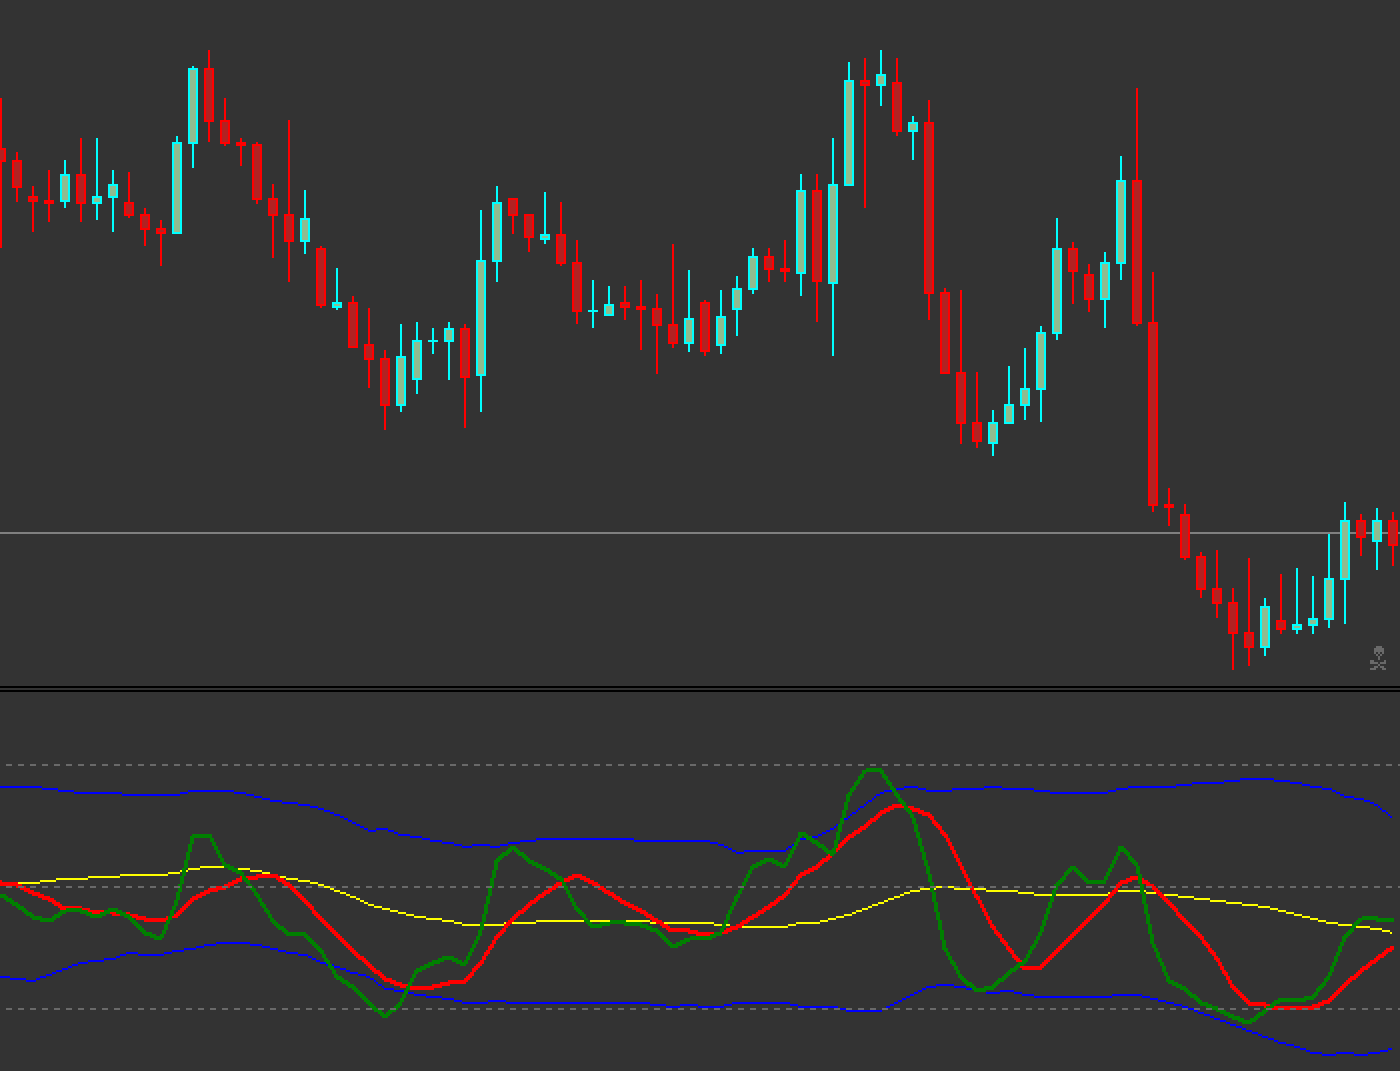
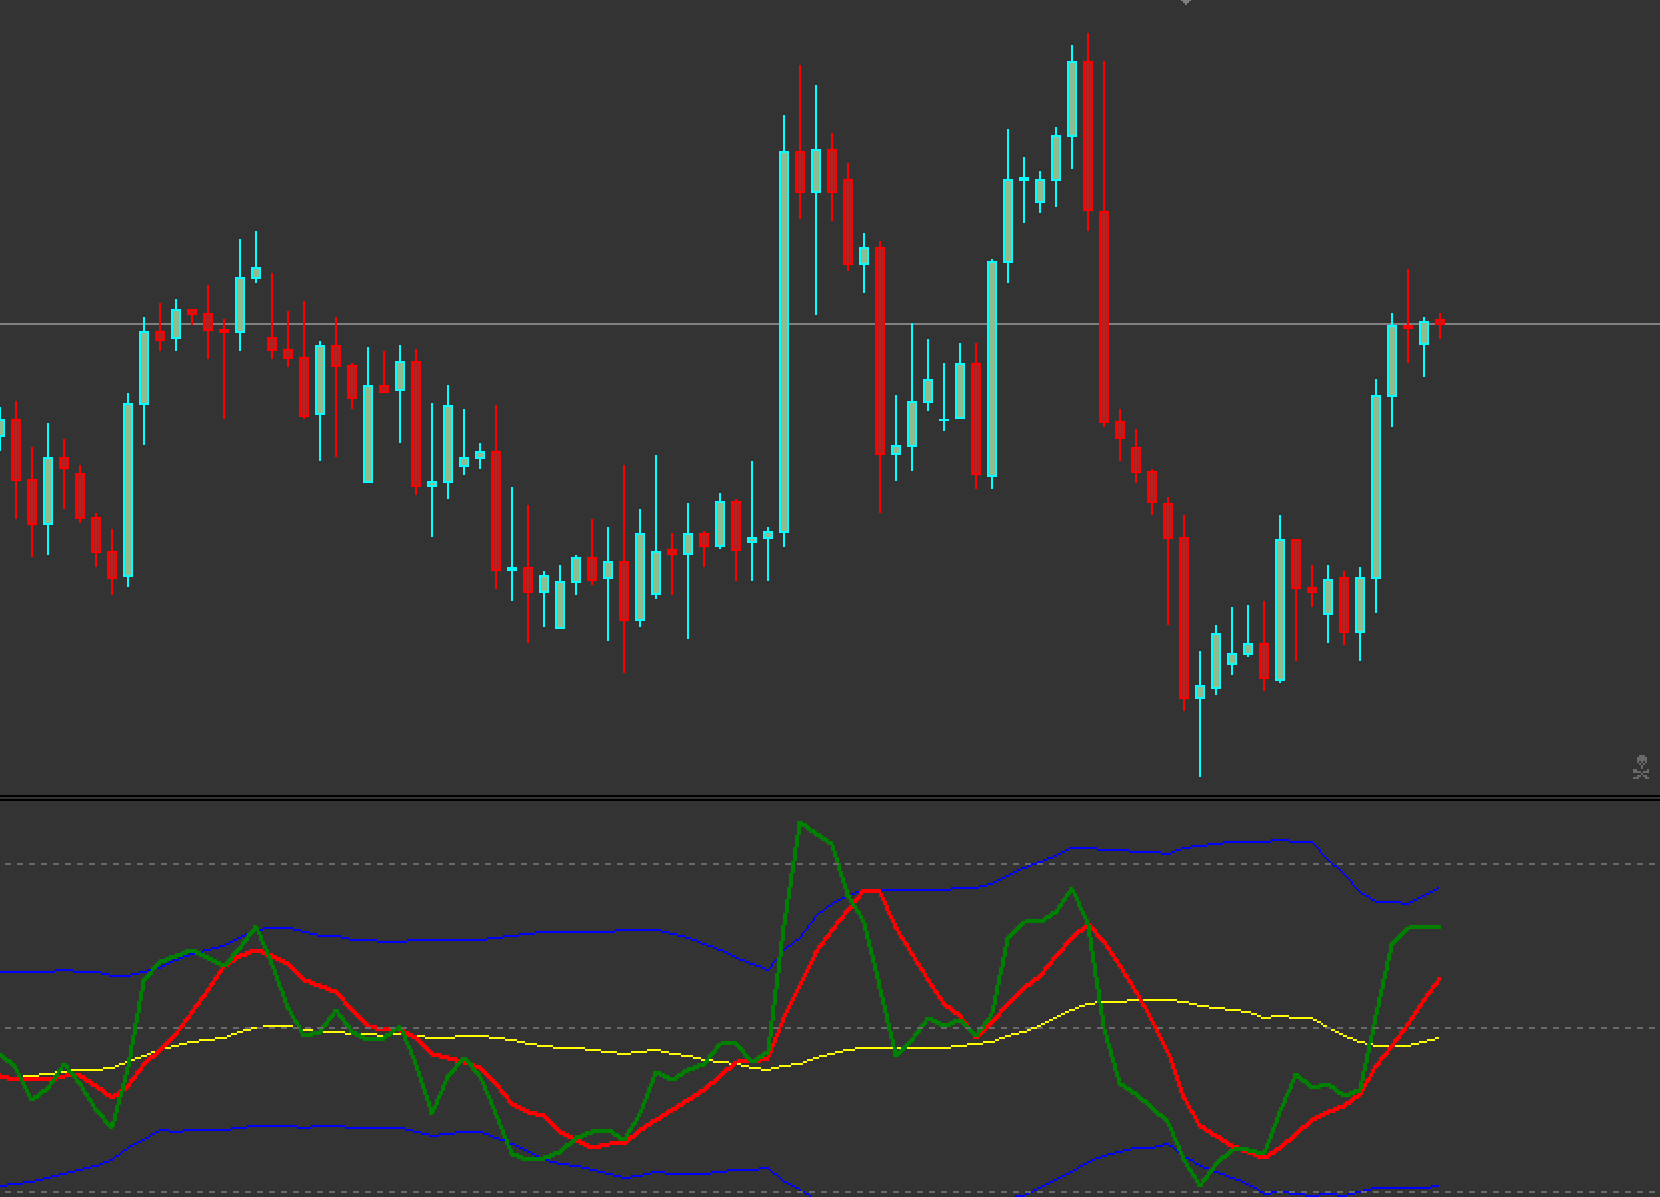
Market sentiment is indicated by the green line. It is similar to RSI. It shows how the market reacts to positive and negative expectations.
The red line is a cross section of the green line and can be used for market entry or exit.
The overall market sentiment is represented by the yellow line. It represents the general trend of the market.
We have two blue lines. One at the top and one at the bottom. These blue lines, similar to Bollinger Bands, show the volatility of the market.
How to use the TDI indicator
This indicator can be used to determine the current trend. A short-term trend change from downward to upward is indicated by a green line above a red line. If the green falls below the red, then the trend is short-term to the downside.
The yellow line is the most important line in the TDI indicator. This line connects all the components of the indicator and makes it tradable. The yellow line can be used to determine the long-term trend. If the yellow line is drawn outside these limits, it can indicate a possible trend change.
The indicator also indicates market forces.
If the slope of the green line is higher than the others, market participants will generally be more powerful. If the line is running horizontally rather than vertically, it is an inactive market.
Wider Bollinger Bands indicate increased volatility. Narrowing Bollinger Bands indicate a decrease in volatility. A significantly narrower line means that there will be any major reports or other news that could have a significant impact on the market. In this case, it is best to avoid trading.
Trading strategies for the TDI indicator
This indicator can be used for short-term or medium-term trading. When using the TDI indicator to find signals, you should use the H-1 time frame or a higher time frame.
TDI Buy Settings
The green line should be above the yellow or red line
Wait for a bullish candlestick to appear
Set a stop loss at the nearest low
Exit when the green line falls below the red line
Summary
The TDI RT Alert Divergence indicator can be used to determine market trends and volatility.