 BG Chipper Trading BOT for NinjaTrader8
 Forex Profit System

Forex Profit System
EMA Trading System
This System Iam combined w/ASI and Pip Boxer indicator
This System Works with all types of time frames & Currency
Setting : Forex
chart
Time Frame 1M and 5M ( I used 5m
/ scalping)
EMA 25, EMA 50, EMA 100
Parabolic Sar : .02 and 2 ( default )
Time Frame 15M, 30M,
H1
EMA 10, EMA 25, EMA 50
Parabolic Sar : .02 and 2 ( default )
Window Indicator
Accumulative swing index
Pip Boxer Indicator period 14 or 7
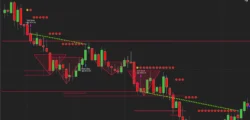
Buy = Long When the EMA 10
crosses The 25 and 50 OR when
the EMA25 crosses The 50 and 100 – UP from the bottom
See.. the ASI indicator and / or Pip Boxer indicator on the bottom / below 25 %
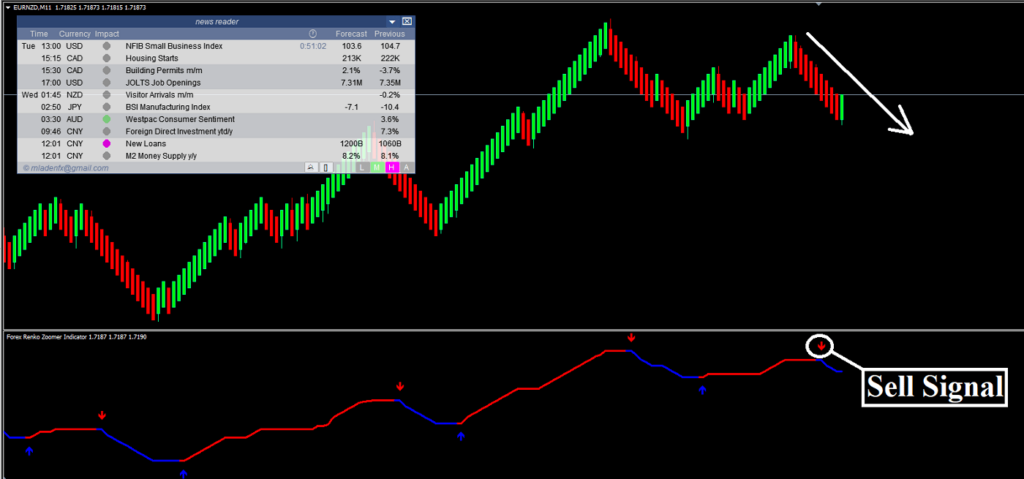
Sell = Short
: If the EMA 10 cross The 25 and 50 OR When the EMA 25 cross the 50 and 100 – Down from the
Top, you go Short / SELL
See.. the ASI indicator
and / or Pip Boxer indicator on the top / more than 75 %
MAKE SURE THAT WHEN YOU GET INTO YOUR TRADE THAT THE PARABOLIC SAR IS ON THE BOTTOM WHEN YOU GO LONG…AND ON THE TOP WHEN YOU GO SHORT
Exit Trade : The best Time to Exit a trade is when the price crosses back down
all 3 EMA’s on the Chart…
Images 1. chart GBP/USD TF 5M
Images 2 GBP/JPY H1
Share your opinion, can help everyone to understand the forex
strategy.
- Platform: Metatrader4
- Currency pairs: Any pairs, indices and metals
- Trading Time: Around the clock
- Recommended broker: icmarkets, XM
- How to install MT4 indicator?
- 1. On the desktop, double-click to open the MT4 trading platform software you installed.
- 2. Click on “File” – “Open Data Folder” in the upper left corner, double-click the MQL4 folder, and double-click the Indicators folder
- 3. Copy the metrics you need to install to the Indicators folder
- 4. Open MT4, find “Navigator” in the display menu, then click “Technical Indicators” of “Navigator” and right click to refresh, you will see the indicator just copied.
- 5. In the “Technical Indicators” of “Navigator”, find the indicator file just installed, double click or click manually to the chart window

Responses