-
Currency Pairs Correlation Indicator TUTORIAL
While this page contains a lot of information that is also on the sales page, it contains more details about each part of the indicator.
https://www.fx141.com/product/currency-pairs-correlation-indicator-download/
CORRELATION INDICATOR INSTALLATION:
Copy and paste the Indicator EX4 file to the Indicators folder in MT4 under MQL4/Indicators. To locate the MQL4 folder, click File/Open Data Folder in your MT4 menu. Then open your Navigator in MT4, place your cursor over the Indicators folder, right-click and select “Refresh”. The indicator will appear in a few seconds.
PRESET FILES
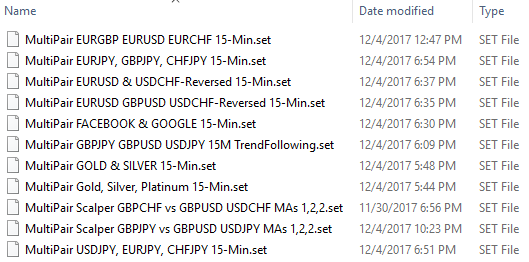
To get you off to a running start (and to save you a lot of time), I am including most of the settings used on this webpage. The following Preset files are included with your purchase.
PRESET FILES INSTALLATION:
To make it easy to locate these indicator presets, save the entire folder named “Multi-Pair Indicator Presets” in your MT4 presets folder under MQL4/Presets. To locate the MQL4 folder, click File/Open Data Folder in your MT4 menu.
IMPORTANT TIP: Before attaching the indicator to your TradePair chart, load the charts of the other pairs you intend to reference in the indicator and scroll the charts back to the date you want the correlations to begin on so the data is already stored in MT4. If you don’t, the indicator will give you an error message stating you do not have enough data for the correlation. You do not need to keep these other charts open to run the indicator in real time. The indicator instructs MT4 to load the data internally but I like to keep the correlation charts open so I know for certain they are updating in real time.
Indicator Details
This indicator compares price data from up to 3 different currency pairs. It was designed for comparing currency pair correlations but it also works on stocks, commodities and crypto currencies (whatever your broker offers in MT4). The only requirement is that each stock & commodity must be on the same exchange so their trading hours match.
I designed this indicator to be very versatile. It can be used to trade many different strategies from scalping to hedging to simple trend-following based on an average trend direction of 2 or 3 currency pairs or it can signal only when all 3 pairs correlate. Here’s the primary parts that make up the indicator:
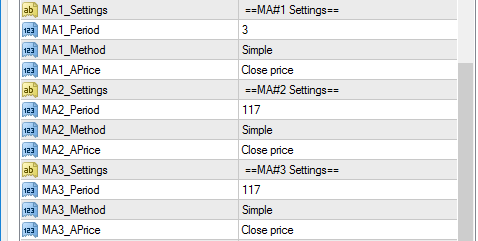
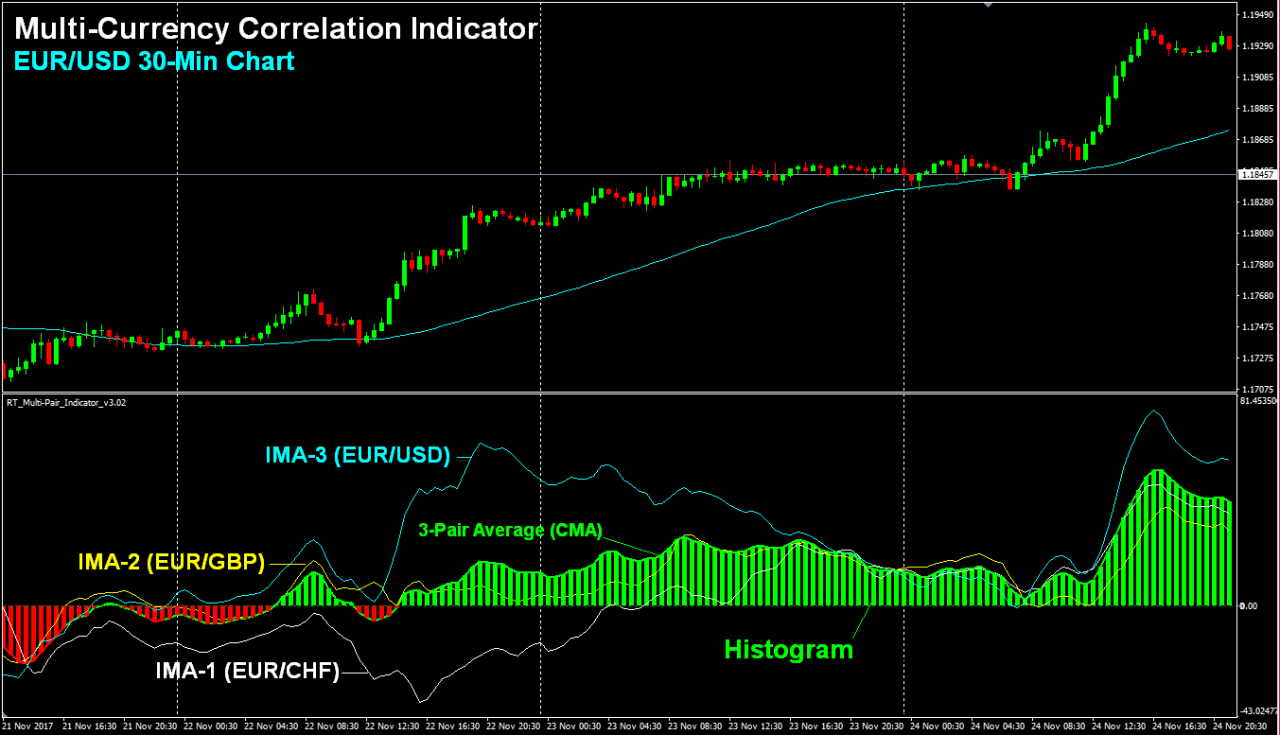
3 Moving Averages: The indicator automatically applies the same moving averages on the same time frame on each of the 3 correlation pairs (or just 2 pairs if you choose) then measures the distance between the moving averages to create an IMA (Indicator Moving Average) for EACH of the 3 currency pairs. An IMA is the moving average of the 3 Moving Averages so having 3 points to measure from gives you a lot of flexibility. In the indicator settings, these are named: MA1, MA2, and MA3. If you set MA1_Period to 1 based on the Candle Close, you are literally measuring the distance between the closing price of the candle to MA2 and MA3. The formula to create an IMA is (MA1-MA2) + (MA1-MA3)/2, which gives you an average distance between MA1 and the other two moving averages. When MA2 and MA3 are different values, you get more wavy IMAs, which creates a more wavy 3-pair average. For a simple trend-following strategy, I normally leave MA2 and MA3 as equal values so I can clearly see the average trend strength and direction of the 2 or 3 currency pairs I’m comparing.
Moving Average Settings
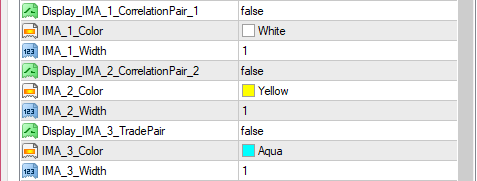
IMAs (Indicator Moving Averages): Using the formula (MA1-MA2) + (MA1-MA3)/2, each IMA represents the trend strength and direction of one of the correlation pairs and is plotted as a separate moving average in the indicator field along the bottom of chart of the pair you’re trading. With all 3 IMAs in one location, you can easily see how each currency pair is moving relative to each other. You have the option to display the IMAs or hide them. An IMA below the zero line means the sum of the IMA formula is negative (indicating a down-trend) and an IMA above the zero line means the sum of the IMA formula is positive (indicating an uptrend). As a simple example, if your 3 moving average settings are 1, 100, 100 and price is 25 pips above SMA 100 on one of your currency pairs, your IMA value for that pair would be +25 and the IMA would be plotted as +25 above the zero line.
IMA Display Settings
The 3 IMAs Displayed (USD/CHF value is reversed to show USD correlation)
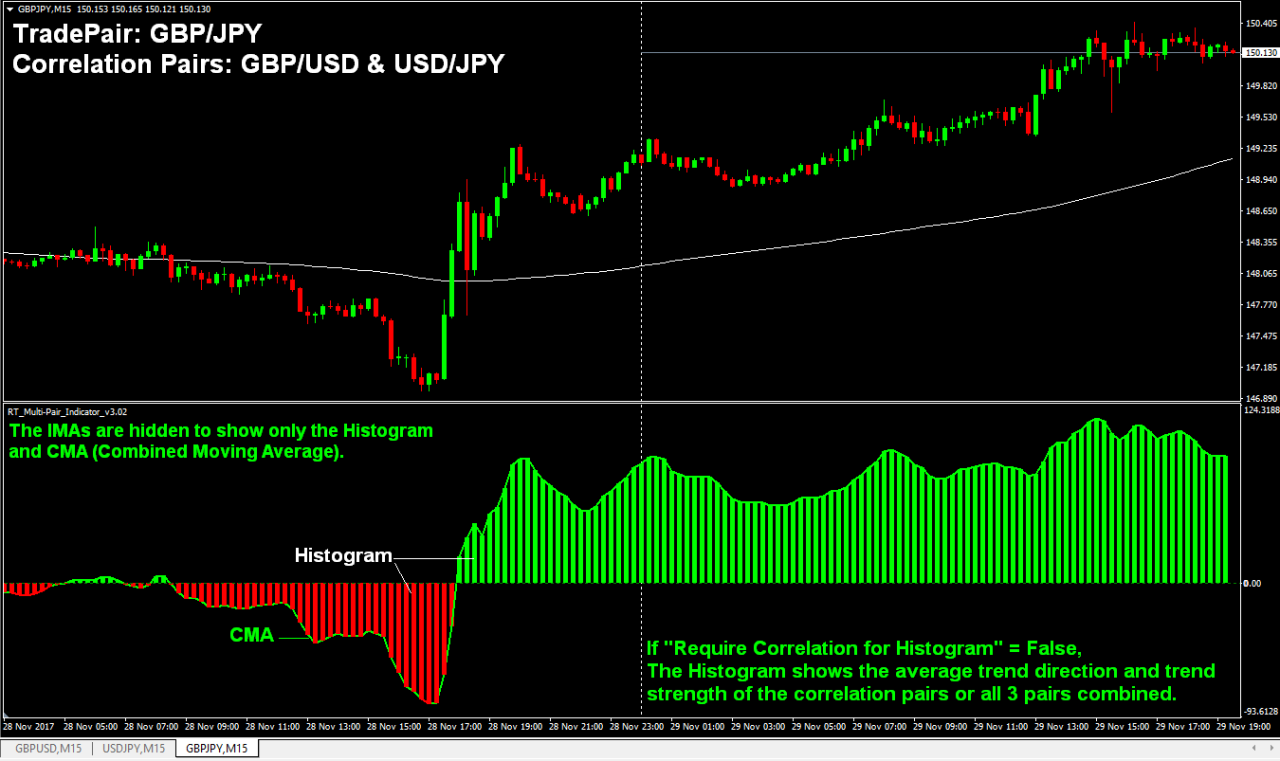
CMA (Combined Moving Average): The CMA is the green or red moving average in the indicator field and it is the average of all 3 currency pairs, or just 2 pairs if you choose to exclude the TradePair. The CMA is green above the zero line and turns red below the zero line during correlation. You can divide the CMA value by 1, 2 or 3 depending on the number of currency pairs you are including in your CMA value. Or enter a value of 1 when comparing 2 currency pairs that normally have reverse correlation, like GBP/USD and USD/JPY where USD is inversed in each pair. When USD gains value, USD/JPY goes up and GPB/USD goes down. Therefore if one IMA has a value of +50 and the other has a value of -50, your CMA value is zero and they cancel each other out. But if one pair is at +50 and the other is at +25, then you get a CMA value of +75 instead of an average value of 37.5. Normally these 2 currency pairs trend in opposite directions but sometimes they correlate and trend the same direction. When this happens, you usually get large exaggerated moves on GBP/JPY, which is where I originally got the idea for this indicator. But after studying this indicator’s various features, I’ve discovered many more applications for it.
CMA (Combined Moving Average) Settings
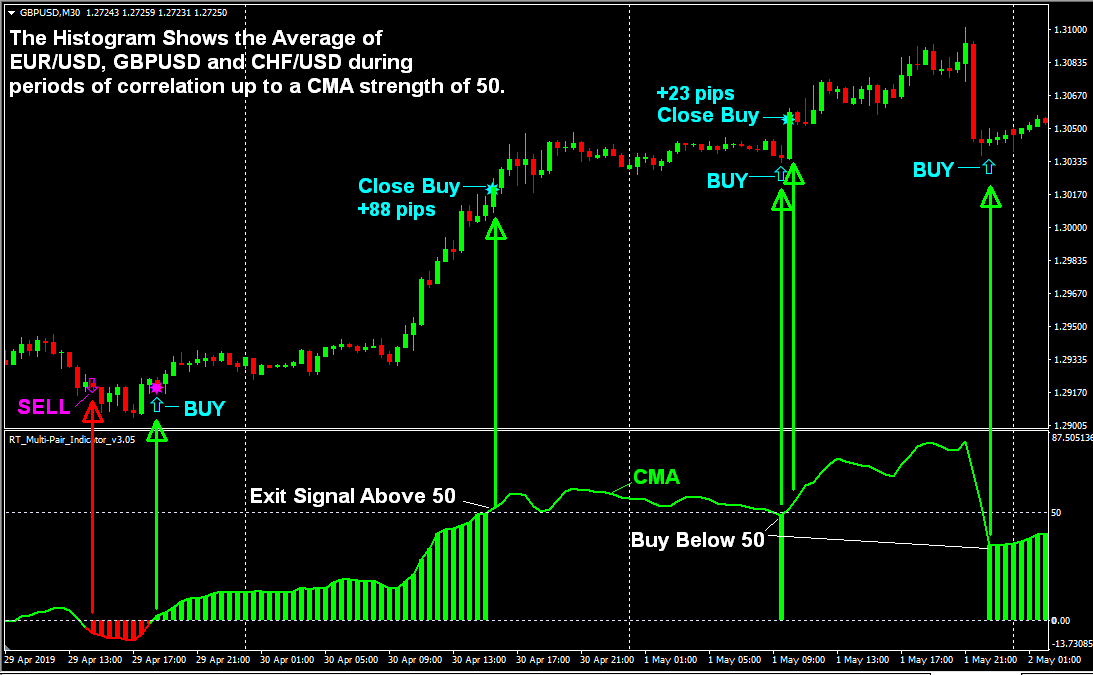
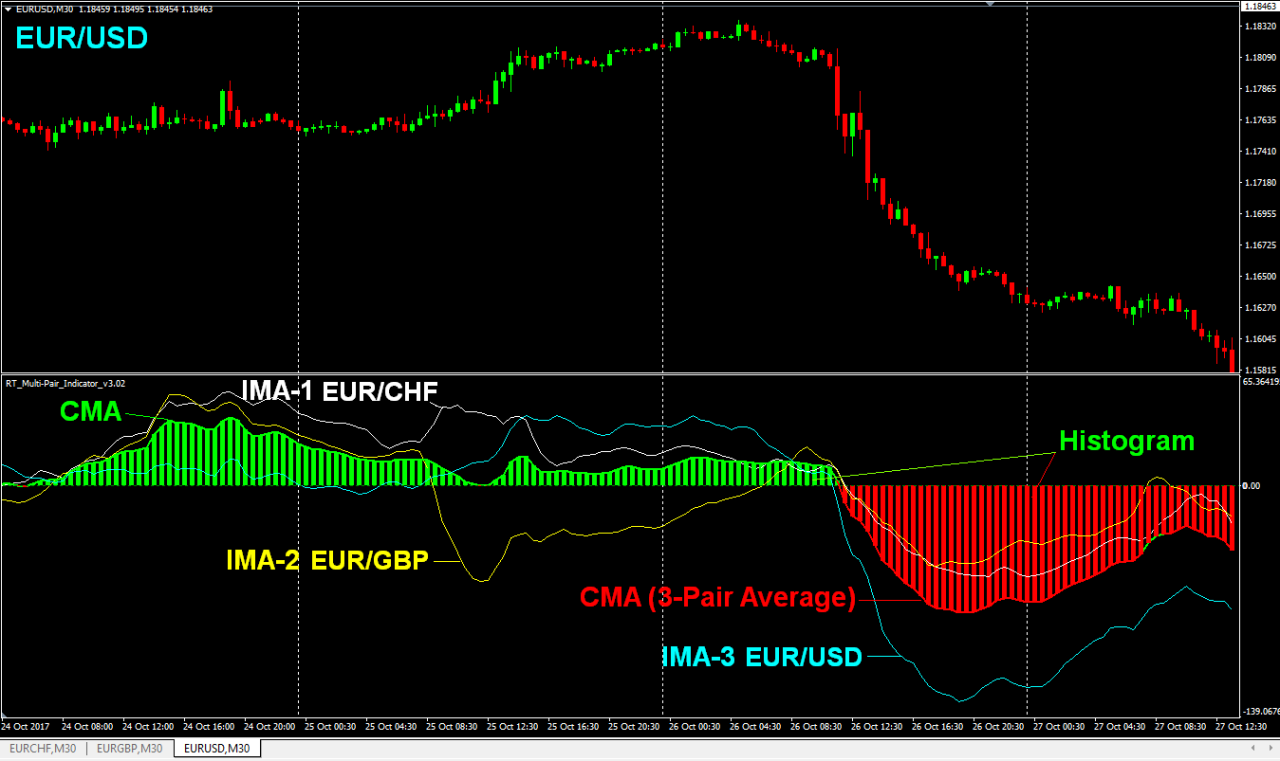
Histogram: The Histogram and CMA will always have the same value. But with a True/False switch, the Histogram can represent two different things. When “Require_Correlation_to_Display_Histogram = False”, the Histogram merely represents the average trend direction of all correlation pairs included in the CMA value and it is just a visual filler between the zero line and the CMA. The Histogram turns green above the zero line and red below the zero line. The Zero Line in the display represents the average of MA2 and MA3 in your settings. When the Histogram turns green (above the zero line), it means MA1 is above the average of MA2 and MA3 across all 3 pairs. When it turns red, it means MA1 is below the average of MA2 and MA3 across all 3 pairs.
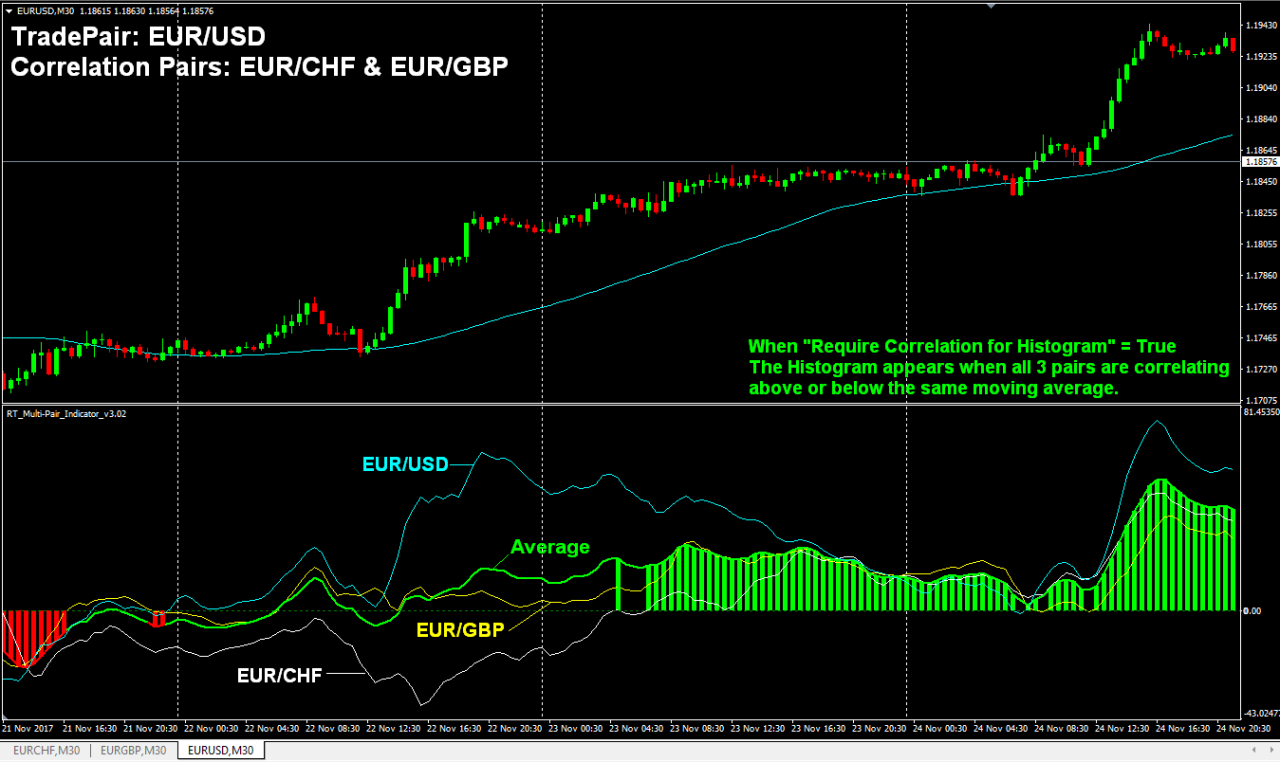
Histogram During Correlation: Correlation occurs when MA1 is on the same side of MA2 and MA3 on all 3 pairs simultaneously. This is usually displayed as all 3 IMAs on the same side of the zero line. To identify when correlation is occuring, set “Require_Correlation_for_Histogram = True” and the Histogram will only appear during periods of correlation between all 3 currency pairs so you can easily see when correlation is occurring. The trade arrows and signal alarm will occur any time the first bar of the histogram appears, which means you can set it to signal only during times of correlation if you want.
Histogram & Correlation Settings
CMA Strength Min/Max: The histogram will only appear when the CMA value is within these specified ranges on each side of the zero line. UpperLevel is the scale above zero and LowerLevel is the scale below zero and you must use negative numbers for the LowerLevel. The Minimum Strength helps filter out weak false signals during choppy low-volatility market conditions. The Maximum Strength stops the Histogram from appearing when the CMA value (Average Trend Strength) gets too strong and it works like a profit target. When the Histogram appears, you ge an Entry Arrow on the chart. When the histogram stops or changes color, you get an Exit Arrow on the chart, but this would be the simplest use of this indicator. There are many more strategies it can be used for, as you will see in the coming EAs that auto-trade off of this indicator.
CMA/Histogram Strength Settings
Trade Arrows: The Trade Entry arrows appear in the larger candlestick area of the chart when the Histogram appears and purple Exit Stars appear when the Histogram stops. You have the option to reverse the trade arrow direction and also hide the arrows if you don’t want to see them. You may also enable/disable the audio alerts and pop-up alerts when a signal occurs.
Create a Mini EURO Index with EUR/USD, EUR/GBP and EUR/CHF.
The Histogram & CMA show the Combined Moving Average of the 3 pairs
Correlation Required for Histogram
During a Down-Trend (Correlation NOT Required for Histogram)
The CMA & Histogram show the combined
average of GBP/USD & USD/JPY on a GBP/JPY ChartCorrelation Pair Settings
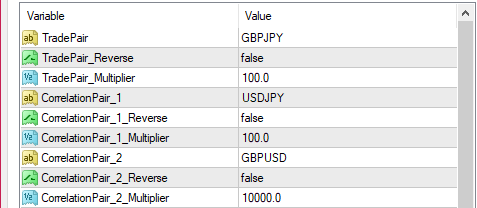
TradePair: This is the currency pair your indicator should be attached to. If you are running the EA, this is the pair that will be traded based on the indicator signals The TradePair’s IMA is IMA_3 in the settings and it can be hidden or displayed in the indicator field. You also have the option to include the TradePair’s IMA value in the CMA (Combined Moving Average) or exclude it so you can compare the TradePair’s IMA to the average of the other 2 correlation pairs. One interesting use for this is to measure how far price of the TradePair overshoots the average of the other pairs (assuming they are closely related). If it overshoots by too much, it may be a good time to take your profit and run before it corrects.
Correlation Pairs (1 & 2): These are the other currency pairs referenced by the indicator and their IMA values will be included in the CMA (Combined Moving Average). Their individual IMAs are IMA_1 and IMA_2 in the settings. They can either be displayed or hidden in the indicator field. If you only want to compare 2 currency pairs, simply list the TradePair also as one of the correlation pairs and use these CMA settings: Include_IMA_3_TradePair_in_CMA: False and Average_CMA_Value_by_1_2_or_3: 2.
Correlation Pair Settings
Multipliers: Here we get a little technical so to keep it simple, set all JPY cross pairs to 100 and all other currency pairs to 10000 (10 thousand). If you want to know the technical details, keep reading…
Since JPY cross pairs have only 3 decimal places vs 5 decimals for all other pairs (at 5-digit brokers), this multiplier allows us to get the number of pips by subtracting one price from another when measuring the distance between the 3 Moving Averages. By using a setting of 100 for all JPY pairs and 10000 for all non JPY pairs, the IMA value represents pips distance between the MAs in each pair. This multiplier variable also allows you to apply weight to different pairs when their pip values are different. For example, the USD value of 1 pip USD/JPY may be 0.87 cents on a 10k lot while the value of EUR/USD is $1 per pip on a 10k lot. So, if you want to measure their correlations in dollar value rather than pips, you would assign a multiplier value of 87 (instead of 100) for JPY pairs when the value of a pip is .87 per on a 10k lot. The USD pip value of JPY crosses varies daily so you would need to constantly update this value. It’s much easier to just keep JPY multiplier settings at 100 so it always displays the IMA value in pips but this gives you the freedom to really customize a strategy.
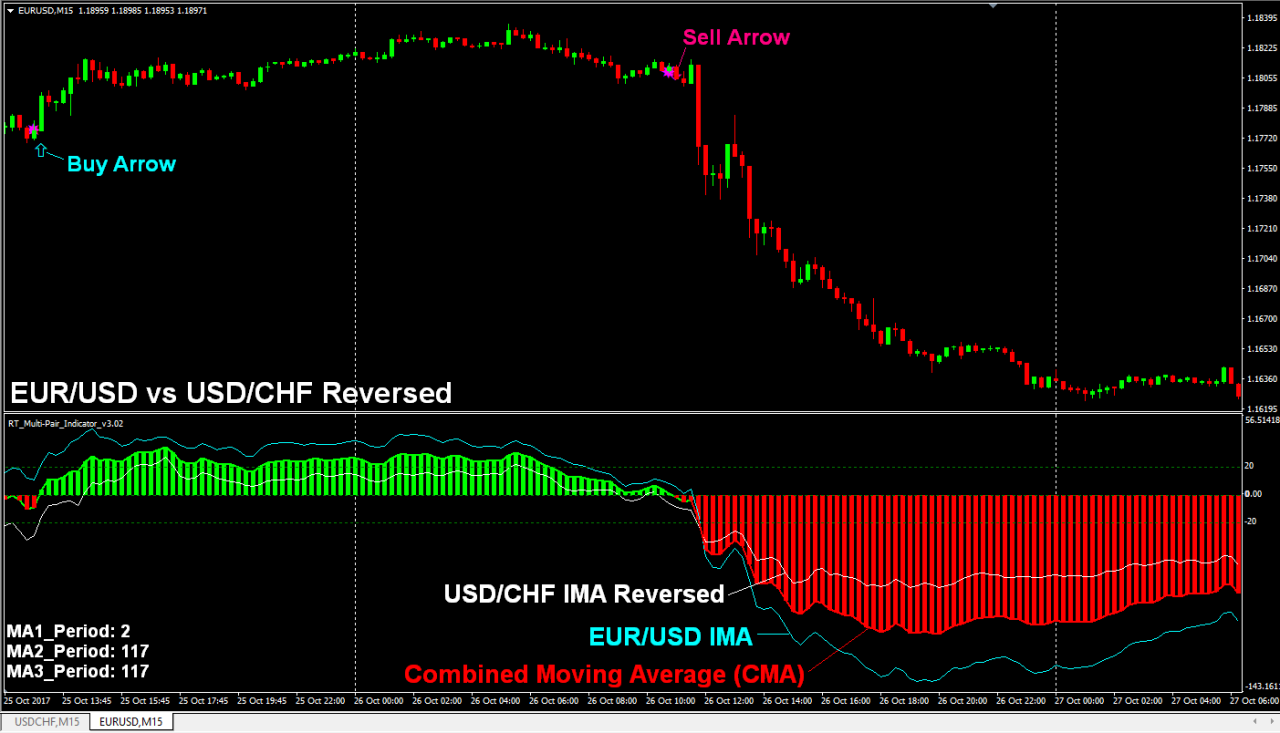
TradePair/CorrelationPair Reverse: How do you get an average trend direction when two related pairs have opposite correlation? Simple! You just flip one upside down and they will now correlate in your indicator. The reverse variables allow you to do this by flipping that pair’s IMA value, turning a positive value into negative and negative into a positive. This allows you to accurately compare and create an average trend on pairs that have reverse correlation like EUR/USD and USD/CHF. With this indicator, you can now create an average trend between them. This allows you to see the market in ways you’ve never seen before and ways most people never will! See example below.
EUR/USD vs USD/CHF Reversed with Trade Arrows displayed
Matching Data: All correlation pairs MUST have the same trading hours or the correlations will be off. This is important if you are comparing stocks, Indices, or CFDs tha trade on exchanges that close daily in it’s country’s time zone. Currency pairs on the Forex Spot market run on the same 24 hour schedule 6 days a week so their market hours always match.
However, it’s important that none of the correlation pairs are missing a candle in its historical data, otherwise, it will throw it’s values off by one candle on all historical data before that. To identify missing data, align all 3 charts across your screen (one above the other) with the period separators displayed starting with the current date and work your way back in time. If the period separators on one pair stop aligning with the others, then it is likely missing a candle in that period. This is most common on Sundays so if you find a discrepancy, check for missing data on Sundays before checking other dates. You can manually add a missing candle through Tools/History Center in the MT4 menu. Use the closing price of the previous candle as the candle opening price and the opening price of the following candle as your missing candle’s closing price so there is no price gap.
Having complete data is important if you want to manually backtest your strategy with the indicator. This is not a problem in live trading since the candles on all pairs will update in real time. But since some pairs can be fed from different price servers, their candle opening time can be off by a few seconds. The indicator will update when all 3 pairs open a new bar, even if they are off by a few seconds.
STOCK CORRELATIONS
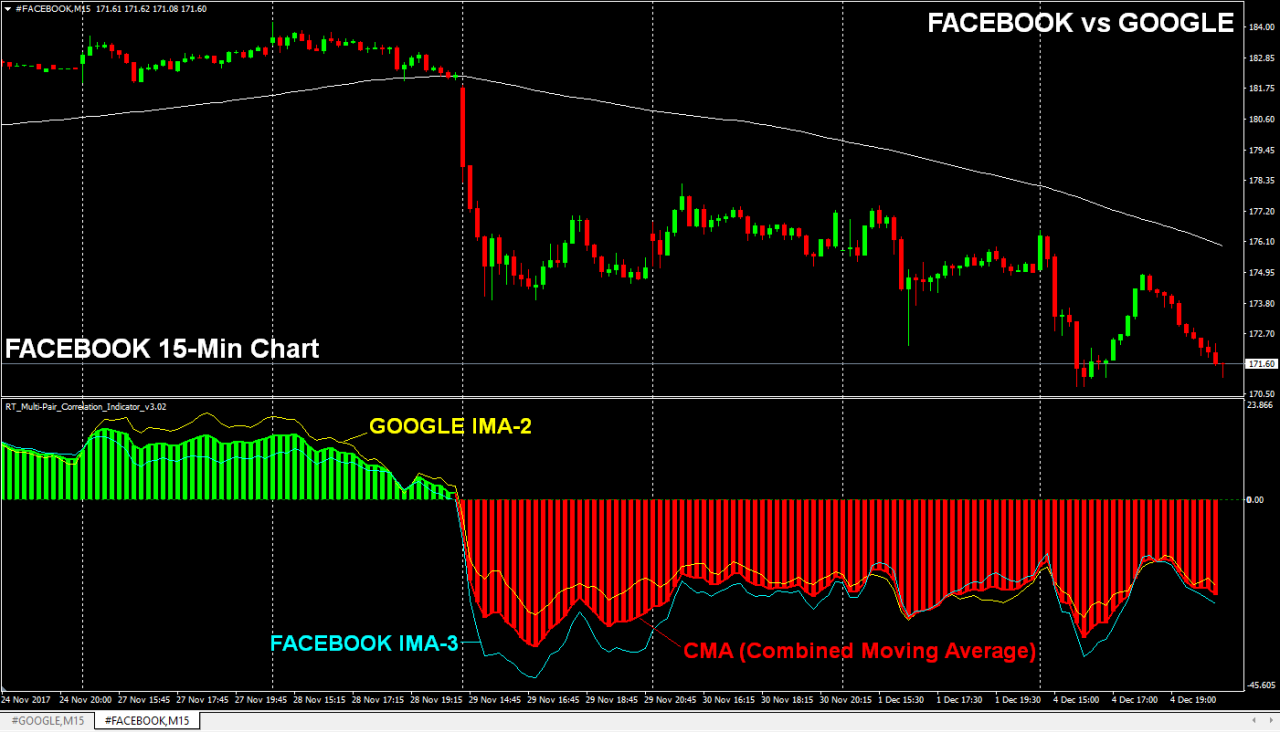
Here I compared 2 similar tech stocks (Facebook & Google). They are on the same exchange so their trading hours match. Since their prices are very different and the indicator calculates values in points rather than percentages, you need to do a little math so you can weigh their values to make them relative. To do this, I took the larger stock price of Google (at $1012.76 per share) and divided it by the smaller stock price of Facebook ($171.60 per share) and got a sum of 5.9. So in the Multiplier fields, I gave Google a weight of 1.0 and Facebook a weight of 5.9. To keep them relative, you should adjust these values weekly or following any significant price changes in either stock. The preset file used in this screenshot is included in your purchase.
COMMODITY CORRELATIONS
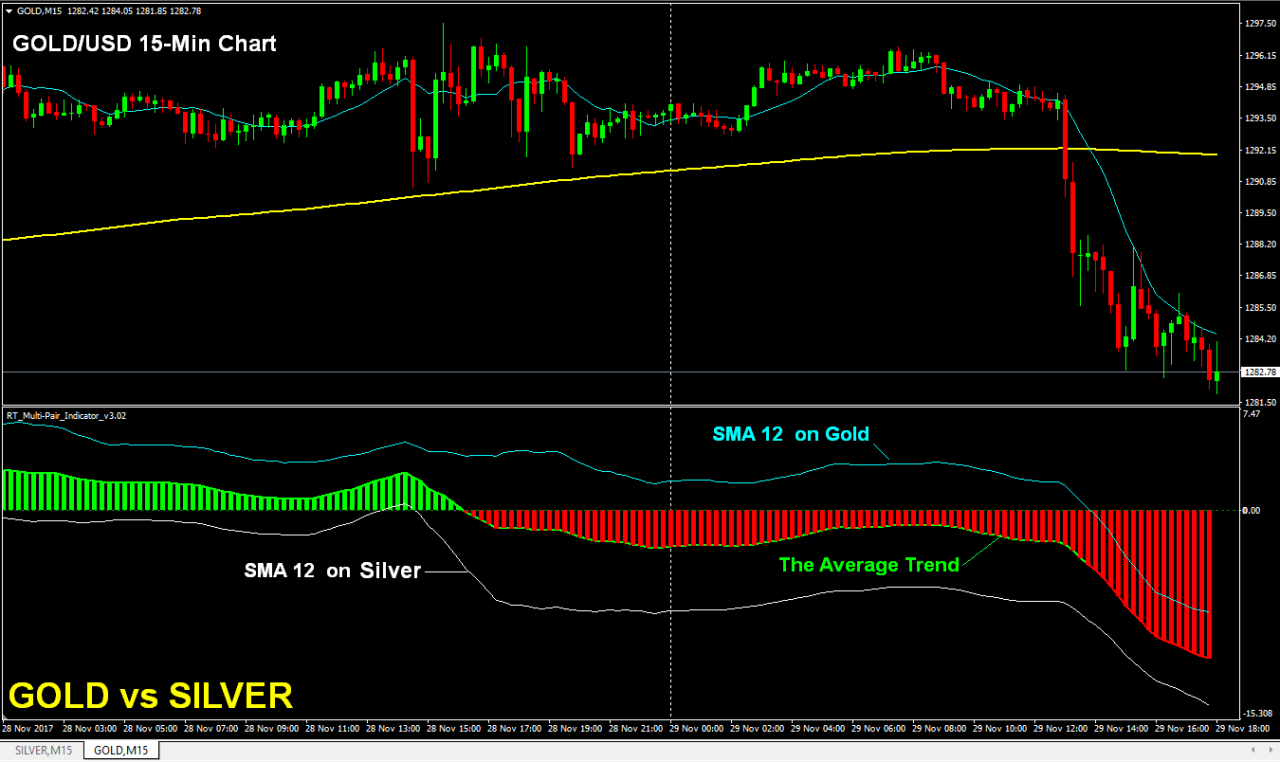
Here I am comparing Gold and Silver to get an average trend direction. Notice the average trend predicted the drop before it happened. Since Gold and Silver are much different prices, I divided the price of Gold by the price of Silver and got a sum of 37.47 so in the Multiplier fields, I applied a multiplier of 1.0 for Gold and 37.47 for Silver. The preset file used in this screenshot is included in your purchase.
CORRELATION SCALPING (GBP/JPY)
By mere accident, I discovered that this indicator is an excellent tool to identify scalping opportunities during correlations that should not really occur. When these correlations do occur, there is usually an exaggerated move on the TradePair followed by a quick correction the other direction. Simply exploit these exaggerated moves in the direction of the current trend for an additional edge.
IMPORTANT: This strategy works best during trends so it would be wise to disable it during sideways or choppy conditions and limit the entries to prime trading hours only unless GBP/JPY is in an aggressive trend.
Scalping Strategy: Trade against very short-term correlations in the direction of the underlying trend. The Scalping EA (coming soon) will be the easiest way to trade this strategy but it could also be done manually with the indicator.
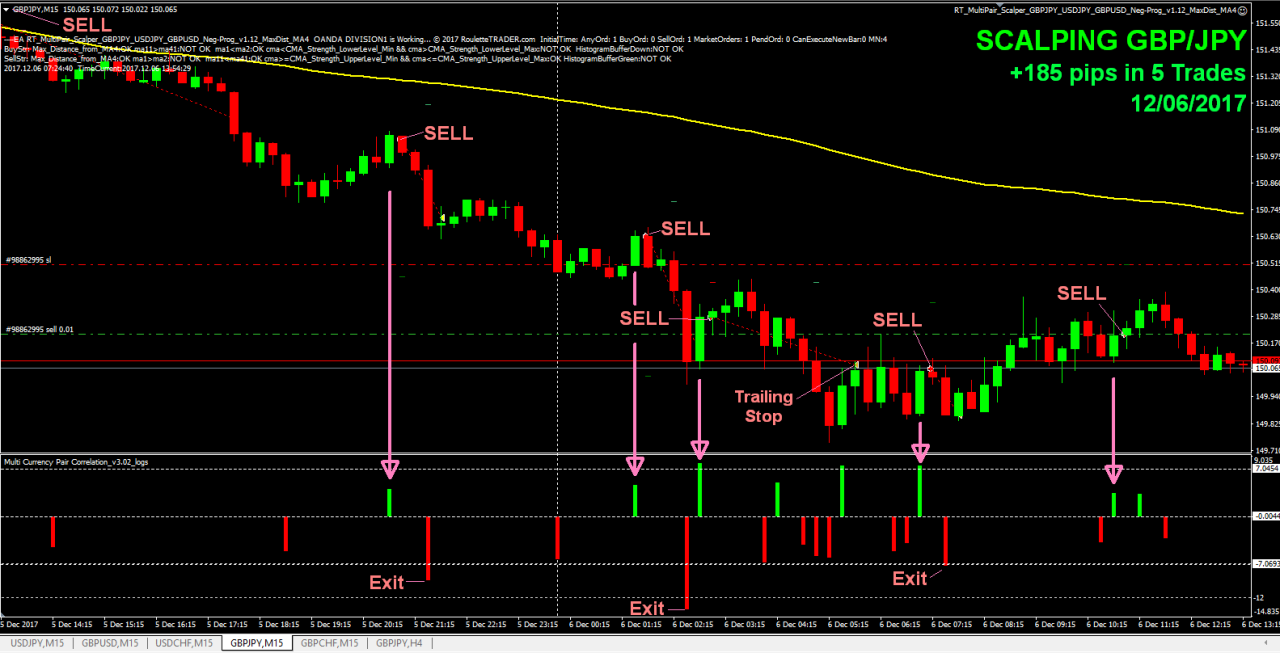
GBP/JPY Scalping Strategy: Open a GBP/JPY 15-Min chart with SMA 117 (to determine trend direction). Attach the correlation indicator and load the GBPJPY Scalping preset file (included with your purchase). The indicator will compare GBP/USD and USD/JPY and look for correlations, which cause exaggerated moves on GBP/JPY.
Buy Signals: Enter Buys on a red histogram bar with a CMA strength of -3 to -12 when price is above SMA 117 (enters buys on correlated pullbacks). Close your buy on a green histogram bar of 7+ on the CMA Strength Scale (closes on a correlated bullish move) or a CMA spike of 12+ on the CMA scale (another chance to get out with a nice profit).
Sell signals: Sell on a green histogram bar with a strength of 3-12 (Sells against a bullish correlation). Close the sell on a bearish correlation with a minmum CMA strength of -7.
Profit Target: Set a profit target of 60 pips.
Stop Loss: Set a 30 pip hard stop.
Trailing Stops: At +25 pips, move the stop-loss to -15. At +50 pips, move your stop to +25.Usually, you will get an exit signal before your profit target is hit but sometimes a valid exit signal doesn’t come in a timely manner when volatility drops so the trailing stops give you another chance to get out of the trade with a profit or a small loss.
The Correlation Scalping EA will be available soon to automate this strategy for you. Here’s live trades using the EA on a test account Dec 5-6, 2017…
GBP/JPY SCALPING
CORRELATION SCALPING
This strategy works best during trends so it would be wise to disable it during sideways or choppy conditions and limit the entries to prime trading hours only unless GBP/CHF is in an aggressive trend.
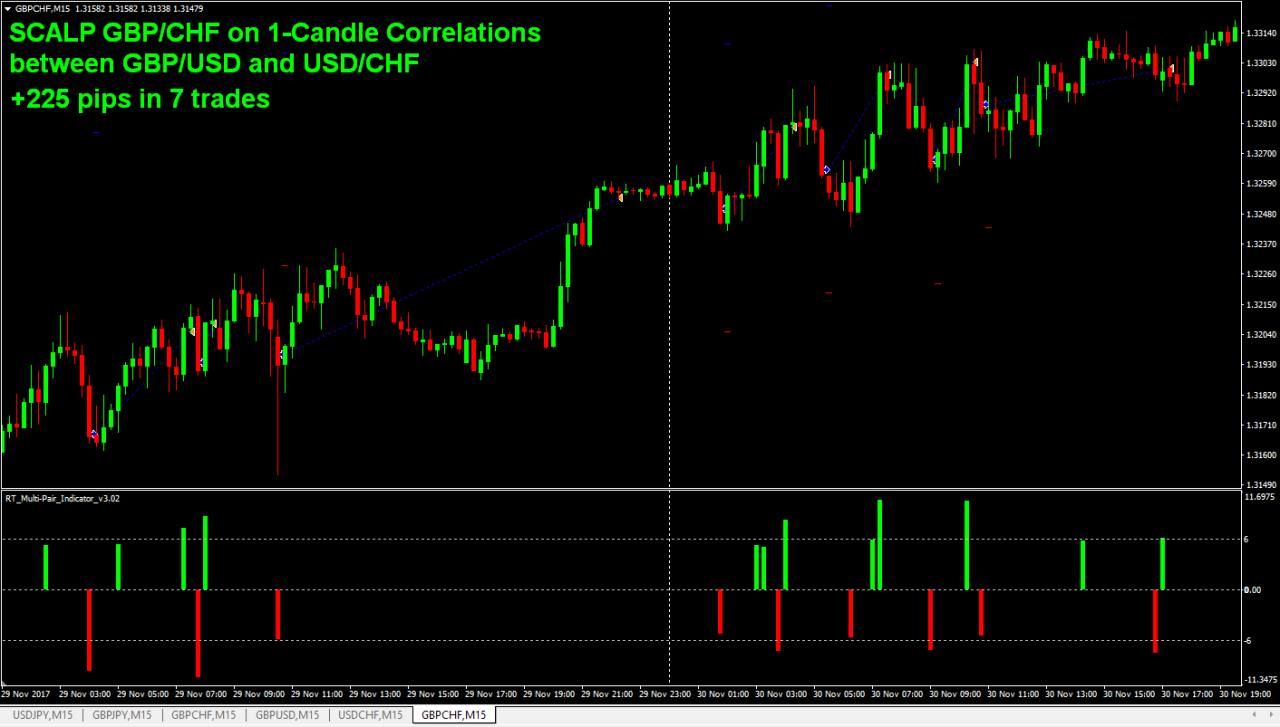
The Strategy: Trade against correlations that occur against the trend (BUY on a Red Histogram in an uptrend, Sell on a Green Histogram in a down-trend) and exit on correlations in the direction of the trend or at large spikes into profit or at your profit target, whichever occurs first. Sometimes you catch a whopper!
To scalp GBP/CHF, you would look for correlations between GBP/USD and USD/CHF, which normally move in opposite directions due to USD being inversed in each pair. When they correlate, you get an exaggerated move on GBP/CHF. The preset file for this GBP/CHF scalping is included in your purchase.
Here’s 2 days of scalping GBP/CHF with the Correlation Scalping EA using the settings displayed by the indicator. These are real trades on a real account. The scalping EA will be available soon.
GBP/CHF SCALPING
The Preset files for the two Scalping strategies above (GBP/JPY and GBP/CHF) are included in your download file. I encourage you to experiment with different settings. As these are relatively new strategies, it could take a while to find the very best settings and the best settings may vary between different market conditions.
Sorry, there were no replies found.
Log in to reply.


