

Description
Works on Currencies, Stocks, Indices, CFDs & Cryptos too!
Currency Pairs Correlation Indicator TUTORIAL
Detail of the indicator
This indicator allows you to compare the price correlations of up to 3 instruments at once. This indicator was originally designed to compare currency pair correlations, but it can also be used on stocks, commodities, and crypto currencies (depending on what your broker offers in MetaTrader 4). Only one condition is required: each instrument must be on the exact same channel. exchange so their trading Hours match.
This indicator was designed to be versatile. It can be used in many ways. trade many different strategies from scalping to hedging to simple trend-following based on an average trend Direction of 2 or more currency pairs. It can also indicate when all 3 pairs are correlated on the same side or a specific moving average. The indicator applies the same moving average settings to all 3 pairs of correlation pairs within the same timeframe, so correlations are always relative.
Terms you should know…
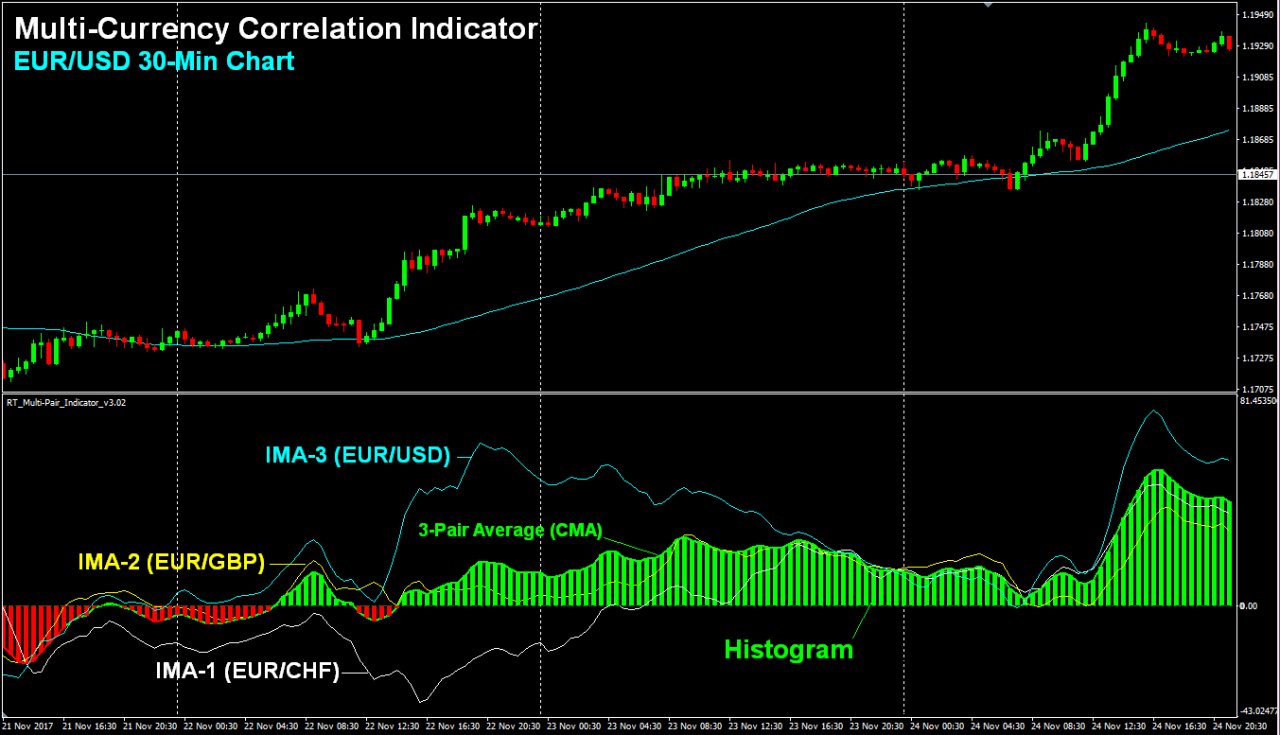
The term “IMA” stands for “Independent Moving Average“. IMAs These are the colored lines within the indicator field. Each line represents a different pairing. There are 3 pairs that can be referenced: IMA-1 (the TradePair), IMA-2 (the TradePair), and IMA-3.
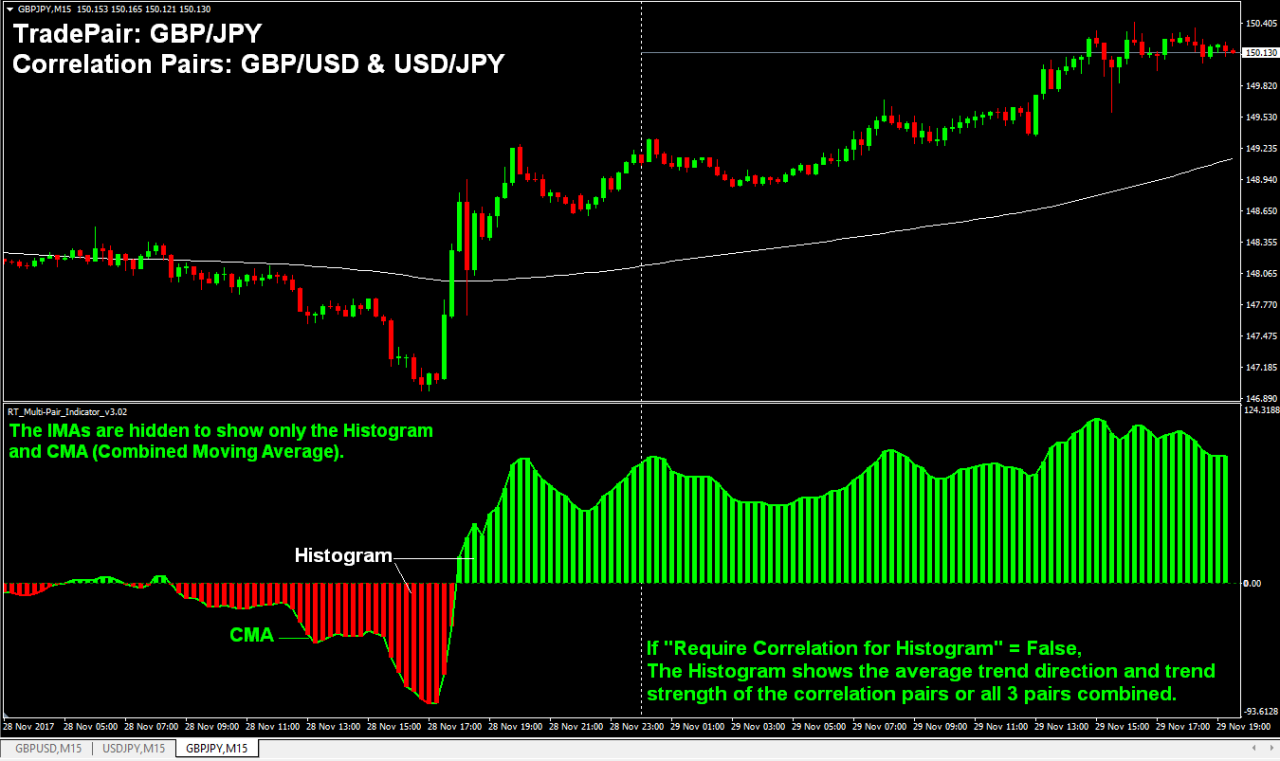
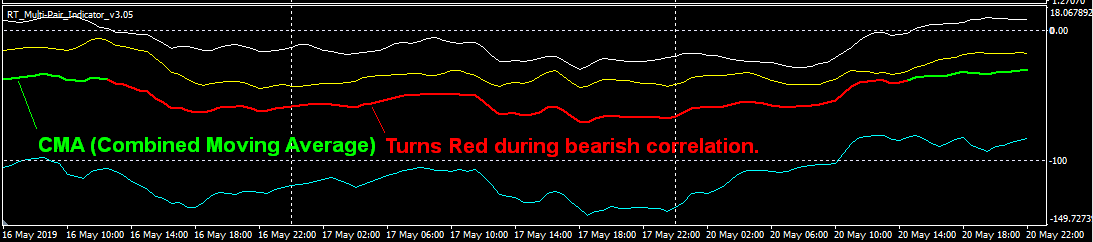
The term “CMA” stands for “Combined Moving Average“It is the green- or red-line in the indicator field that represents the “Average Trend“ The average of all the correlation pairs (you can exclude the TradePair, IMA3) from this average).
The “Histogram“is the red or the green bars that extend to the CMA Line. This means that the CMA and Histogram both have the same value, although each can be displayed separately. When “Require correlation for histogram” TrueThe histogram will not be displayed if there is correlation between all three currency pairs.
STRATEGIES…
Here are a few examples. strategies you could use the indicator for.
Follow the Average Trend This is the simplest use of this indicator. The histogram shows the average trend for 2 or 3 currency pairs. You can trade on any of the currency pairs, including 1, 2, or all 3, in the direction indicated by the “Average” trend following The histogram is (Buy during a red histogram, sell during a green). If the Histogram changes from green to red or red to green, it will generate a trade-arrow. You can also reverse the direction of the arrow if you wish to trade against the Histogram’s color (ie. If you want to trade against the Histogram color (ie., buy on red and sell on green), then it will generate a trade arrow. Below is an example that uses the following moving average settings for a 30-Min Chart: SMA 3, SMA75, SMA 75.
Make a Mini EURO Index against other majors.
Below is the average trend between EUR/USD and EUR/CAD.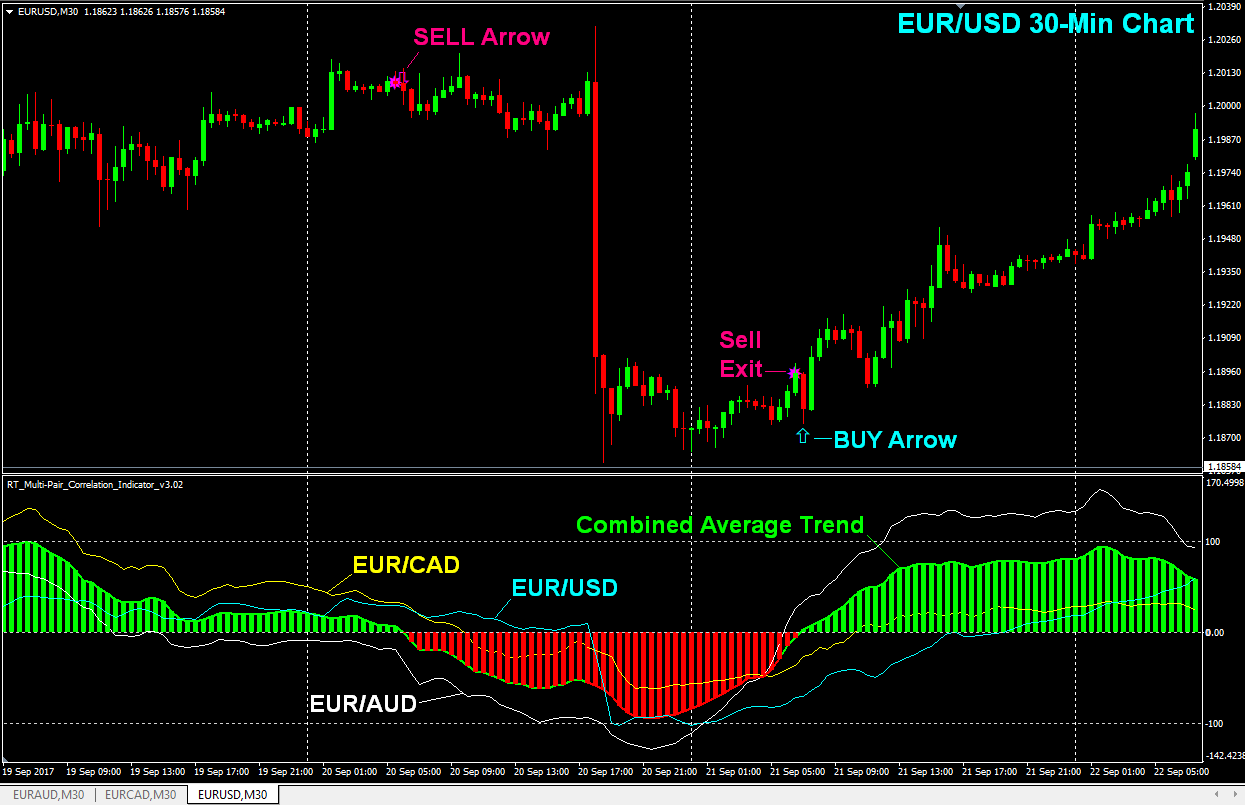
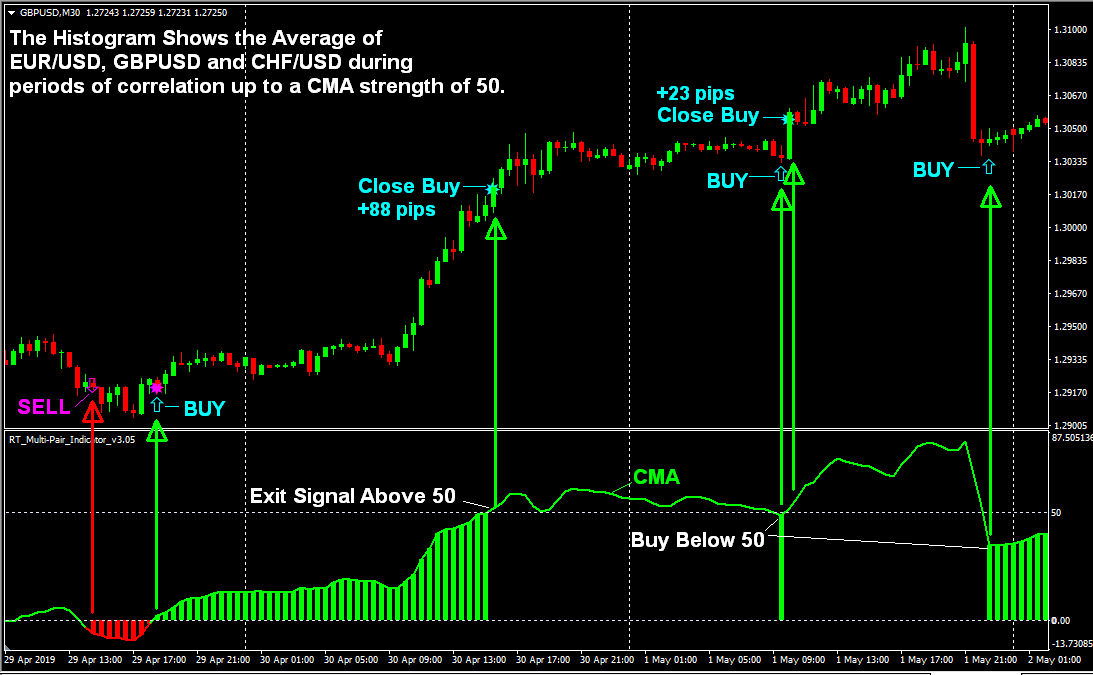
Trend-Riding Highs and Lows You can also set a minimum and maximum CMA/Histogram strength while following the average trend. If the histogram crosses the boundary between the Minimum CMA strength (in the direction of profit), it generates an exit signal. It generates an exit signal if it exceeds the Maximum Strength (in profit direction). If the price drops below the Maximum strength, it will create another entry signal. A trading window may be set at 10-50 pip above the zero line. It will generate a buy sign when the histogram crosses this window and an exit signal if it spikes above 50. Set a window between -10 and -50 to generate sell signals. The Histogram will enter this window when it is strong and exit signals when it drops below -50. profit target that follows the trend Profit spikes and exits
The Histogram shows the average trend in EUR/USD and EUR/GBP respectively.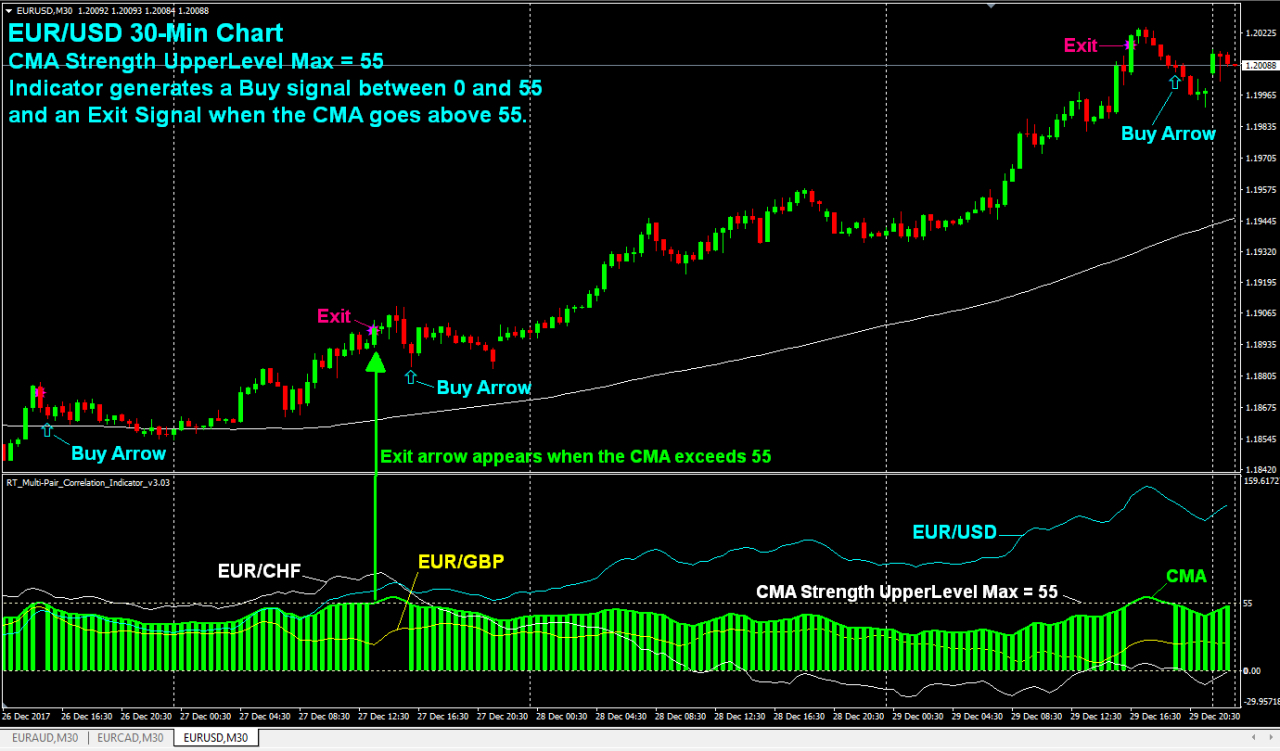
Trade only the strongest pair To minimize your risk and maximize your ROI, trade only the strongest pairs in the direction indicated by the histogram (the average tendency). Using the chart below as an example: You would trade EUR/CHF (the blue IMA line) up to the 2nd Buy Arrow. You would then switch to a long EURUSD position when the blue line EUR/USD crosses above the white IMA (EUR/CHF in the indicator field). IMAs represent each pair of correlation indicators.
Trade with the Average Trend Only During Correlation: If you are only interested in trading the biggest moves with the highest probability of follow-through, you can trade only when 3 similar pairs are moving in correlation (all 3 pairs on the same side of the same moving average). You can use a True/False switch to make the histogram or trade arrows appear only during periods of correlation. The indicator will generage a trade arrow and pop-up alert Where the correlation starts and stops.
Constant Hedge: Follow the histogram of 2 pairs with reverse correlations, such as EUR/USD or USD/CHF, to open 2 trades in the exact same direction. The direction of the stronger trending currency pair will be indicated by the histogram. If the histogram shows green, you can open a BUY order on both currency pairs to hedge USD. If the histogram shows red, you can open a SELL for both currency pairs. This strategy has the beauty that you can’t get huge draw-downs as one pair usually wins when it loses. Your profit will result when one pair trends More than one. If the two pairs you select correlate (e.g. EUR/USD and EUR/CAD), you can reverse the IMA values on each pair so that the histogram clearly indicates the direction of a stronger trending pair.
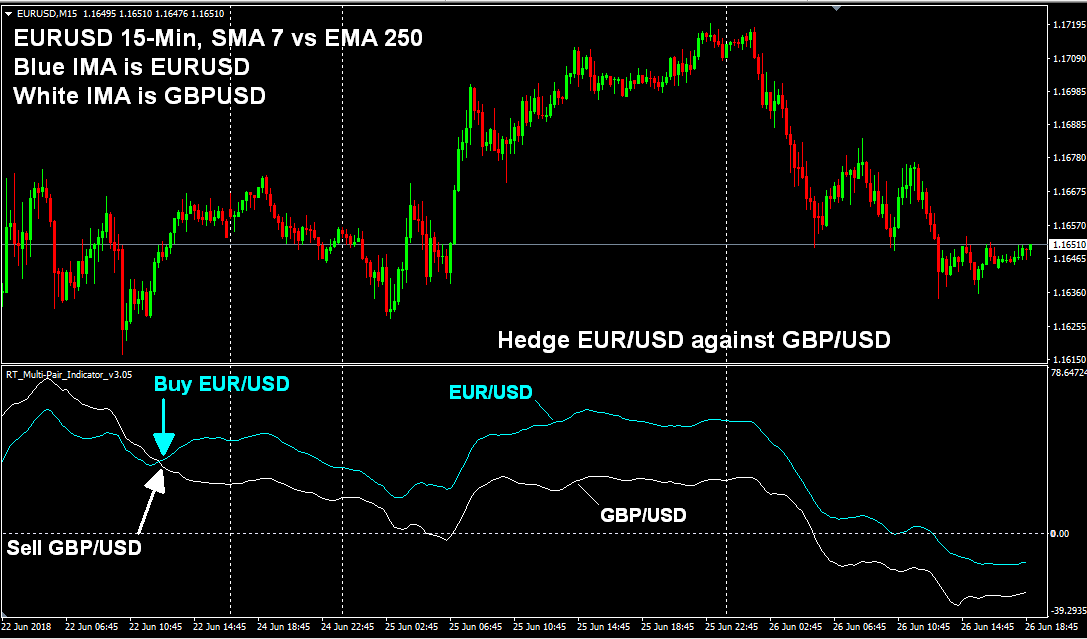
Hedge Correlating Pairs Using the IMAs Trade opposite pairs of 2 pairs that usually correlate. EUR/USD & GBP/USD Or on two pairs of the same base currency, such as GBP/USD & GBP/AUD. Open a Comparing their IMA strengths BUY Position on the pair that has the stronger IMA or open a SELL Position on the pair with the weaker IMA. Change your trade direction for each pair if their IMAs cross the indicator field. You could set a profit goal of “X” pips between each pair of IMAs. If their IMAs cross within 75+ pips, you can close the trades. When their IMA lines cross again, you can open new trades. The Histogram and 3rd IMA can be hidden to create an easy-to-read 2-pair display. Here is an example of how to hedge EUR/USD vs. GBP/USD by using the IMAs.
Trade Non-Correlating Pairs for More Profit Potential: Open a trade on 2 pairs with reverse correlation like EUR/USD vs USD/CHF Or GBP/USD vs. USD/JPY. Open a Comparing their IMA strengths BUY On the more bullish pair, and a SELL You will be more bearish with the pair that is most bearish. You will NOT You can hedge this scenario, but you have more profit potential since they are trending in opposing directions. Change your trade direction for each pair if their IMA indicators cross. Trading this strategy on pairs with reverse correlation gives you more profit potential than when hedging correlating pairs because the more they trend You will make more profit if you move in opposite directions. This strategy can be used in difficult market conditions. A profit target may be set at “X” pips between each pair’s IMAs. The distance between them will be your profit, plus any trending amount. You might close trades when they reach 100 or 200 pips between them, and then open new trades if their IMAs cross again. This strategy uses the Moving Average settings that I love. 2, 100, 100 On a 1-Hour chart.
CORRELATION SCALPING (GBP/JPY)
This was something I accidentally discovered. indicator is an excellent tool to identify scalping There are opportunities when correlations occur that shouldn’t really happen. When these correlations occur, it is often an exaggerated trade on the TradePair that is followed by a swift correction the other way. These exaggerated moves can be exploited in the direction the current trend is heading for an extra edge. Each file contains an indicator preset. scalping strategy Included in your purchase
Scalping Strategy: Trade Avoid multiple-bar or singe-bar counter-trend correlations in direction of the trend. Close the trade on short-term correlations in the direction of the underlying trend (The direction of profit).
GBP/JPY Scalping Strategy: You can execute this strategy at any time (larger time-frames are for larger moves), but in this case, you would open the GBP/JPY 15 Minute chart with SMA117 (to determine trend direction). The correlation should be attached indicator and load the GBPJPY Scalping Included with your purchase is a preset file. The indicator will check for correlations between GBP/USD & USD/JPY. This can lead to exaggerated movements on GBP/JPY.
Buy Signals Enter Buys on the red histogram bars with a CMA strength between -3 and -12 when price is higher than SMA 117 (enters sells on correlated pullbacks). Close your buy if the green histogram bar is 7+ on CMA Strength Scale. This closes on a correlated bullish or CMA spike. 12+ CMA scale (another way to get out with a nice profit, even without correlation).
Signals to sell: Sell on a green histogram bars with strength between 3 and 12 (Sells for a bullish correlation). Close the sale on a bearish correlation with a minimum CMA strength or CMA drop of 7 or less12 CMA scale: or higher (another opportunity to make a nice profit, even without correlation).
Profit Target Based on volatility, set a profit target between 30-60 pips.
Stop Loss: Place a 30 Pip Hard Stop
Trailing Stops Move the stop-loss at +25 pip to -15
You will usually get an exit signal prior to your profit target being hit. However, sometimes a valid exit message doesn’t arrive in a timely fashion when volatility drops. In these cases, the trailing stops allow you to exit the trade with a profit and/or a small loss.
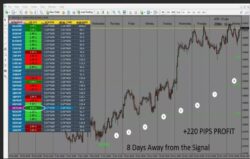
This Correlation Scalping EA It is now Available HERE Automate this strategy for yourself. The EA’s name is “Histogram Trades Following MA4″ It also includes the template and preset files for this strategy. This strategy works best when it is used in strong trends Following major economic announcements, big moves. The EA has been too inconsistent to be used long-term in choppy market conditions. Therefore, it should only ever be activated when there are large movements or trends. Below are some trades that were made with the EA using a test account between Dec 5-6 2017, 2017.
GBP/JPY CALPING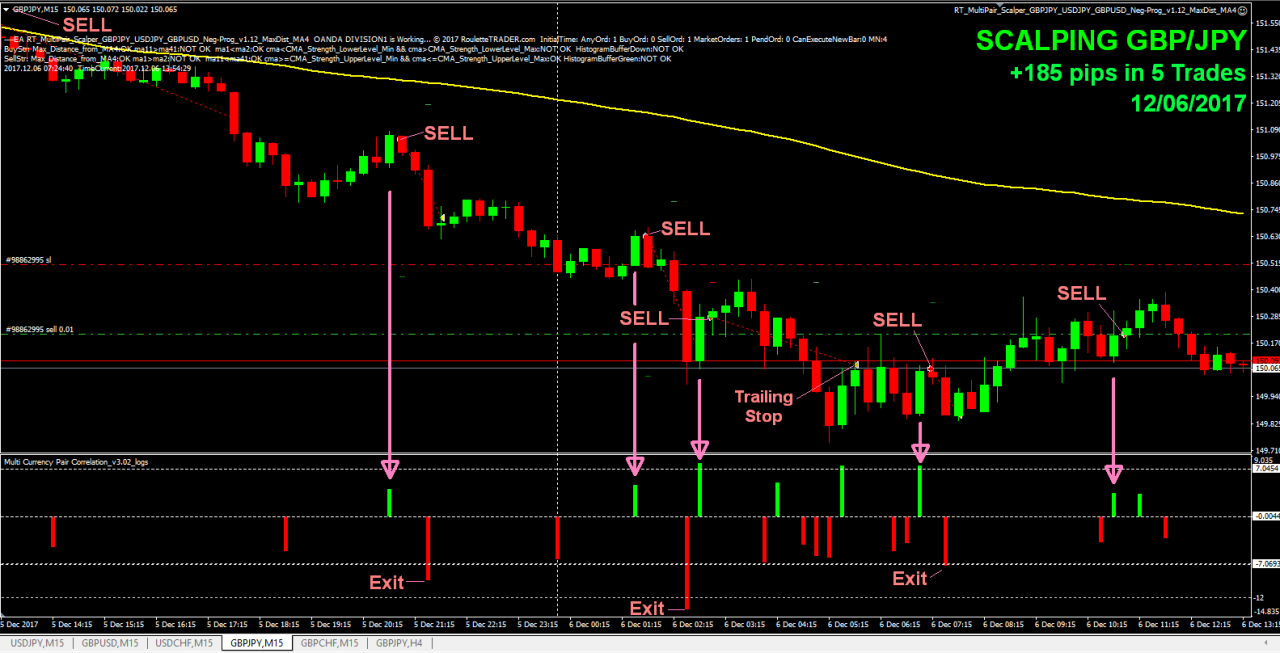
How the Indicator Worked
These are the main components of the indicator.
3 Moving Averages The indicator automatically applies the exact same moving averages at the same timeframe to each of 3 correlation pairs (or only 2 pairs, if you wish). Finally, it measures the distance between moving averages to create an indicate IMA (Independent Moving Average). For EACH The 3 correlation pairs. An IMA is the average moving average of all 3 Moving Averages for a single pair. You have a lot more flexibility when you have 3 points to measure from (3 Moving Averages). These moving averages are named in the indicator settings MA1, MA2, And MA3. To simplify my trend-following strategy, MA2 and MA3 are usually left at equal values (as illustrated below), so that I can understand the average trend strength and direction.
Setting the Moving Average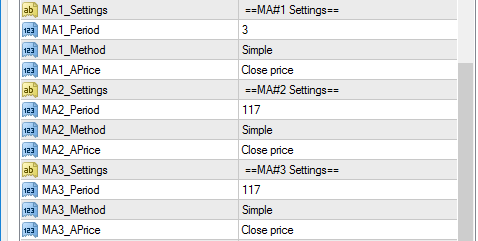
IMAs (Independent moving averages): To create the three IMAs, you will need to use the Moving Average settings. Each of the three colored IMAs represents a different pair of correlations and indicates the trend strength or direction. Each IMA is plotted in its own colored line. indicator field along the bottom of chart of the pair you’re trading. All 3 IMAs are displayed in one location so you can easily view how each currency pair moves relative to each other. The IMAs can be displayed or hidden. An IMA below the 0 line indicates that the summation of the IMA equation is negative. This is a sign of a down-trend. An IMA higher than the 0 line signifies that there is an uptrend.
IMA Display Settings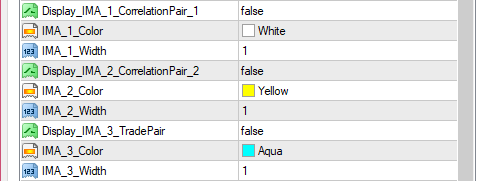
The 3 IMAs are displayed (USD/CHF value reversed to show USD correlation).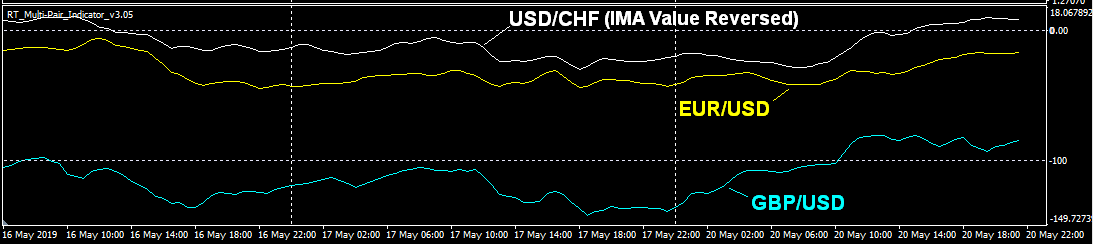
CMA (Combined Moving Average). CMA is the indicator’s green or red moving mean. It represents the average of all three currency pairs or 2 pairs if TradePair is excluded. The default color of the CMA is green. The default color is green. However, during times of correlation, the CMA becomes bolder than the zero line. You can average the CMA value by 1, 2 or 3 depending on the number of currency pairs you are comparing.
CMA (Combined Moving average) settings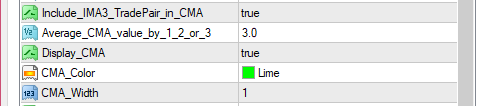
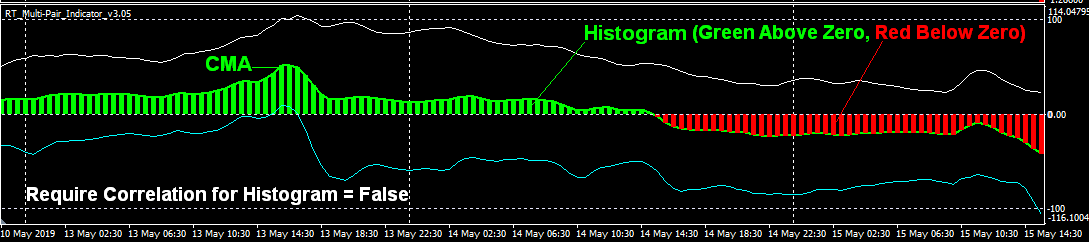
Histogram: CMA and the Histogram will always have the exact same value. The Histogram can be used to represent two things by using a True/False switch. What is the meaning of “Require_Correlation_for_Histogram = False”The Histogram is simply the average trend direction for all the correlation pairs that were included in the CMA value. The Histogram changes from green to red above the zero line. The Zero Line is the average of MA2 or MA3 as shown in the display. Adjust your settings. If the Histogram turns green, (above the zero line), MA1 is higher than the average of MA2 or MA3 across all three pairs. If it turns red it means that MA1 is below MA2 and MA3 in all 3 pairs.
Histogram & Correlation Settings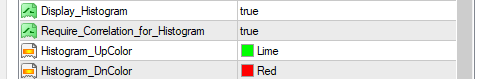
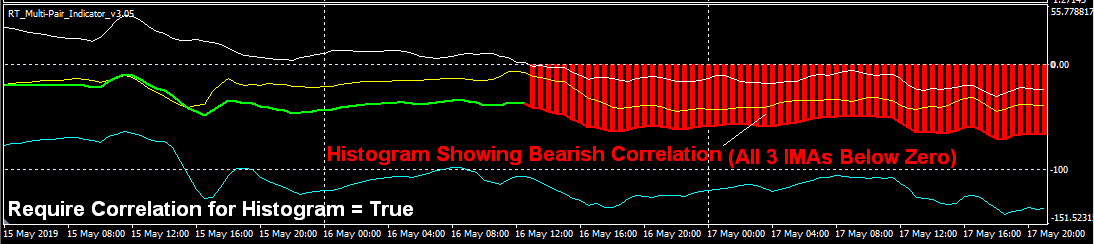
Histogram in Correlation When there is correlation, it happens MA1 is located on the same side as MA2 and MA3 You can use all three pairs at once. This is typically displayed as all three IMAs on one side of the zero line. Set “When correlation occurs” to identify it.Require_Correlation_for_Histogram = True” The Histogram only appears during periods of correlation between all three currency pairs. This allows you to easily identify when correlation is occurring. The trade arrows and signal Alarm will sound at the first bar in the histogram. You can also set it to only signal during correlation times if you wish.
CMA Strength Max/MinimumThe histogram will only be displayed if the CMA value lies within these ranges. UpperLevel refers the scale above zero; LowerLevel refers the scale below zero. You must use negative numbers to indicate the LowerLevel. Low-volatility market conditions can cause weak signals to be filtered out by the Minimum Strength. The Maximum Strength prevents the Histogram’s appearance when the CMA value (Average trend strength) becomes too high. It works as a profit target. You can see the Histogram when it appears. Enter Arrow You can find the chart here. You get an when the histogram stops, changes color or is stopped. Exit Arrow On the chart, this would be the most common use of the indicator. It can be used in many other ways, as you will see from the EAs which auto-trade this indicator.
CMA/Histogram Strength Settings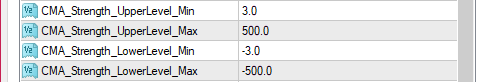
Trade Arrows When the Histogram appears in the chart, the Trade Entry Arrows appear in the larger area of the candlestick. Purple Exit Stars will appear when it stops. The following are the option to reverse the trade If you don’t wish to see the arrows, you can adjust their direction. You can enable or disable the pop-up and audio alerts depending on whether a signal is received.
Here are more examples of the use of the indicator…
You can create a Mini EURO Index using EUR/USD, EUR/GBP or EUR/CHF.
The Histogram & CMA show the Combined Moving Average of the 3 pairs
Histograms require correlation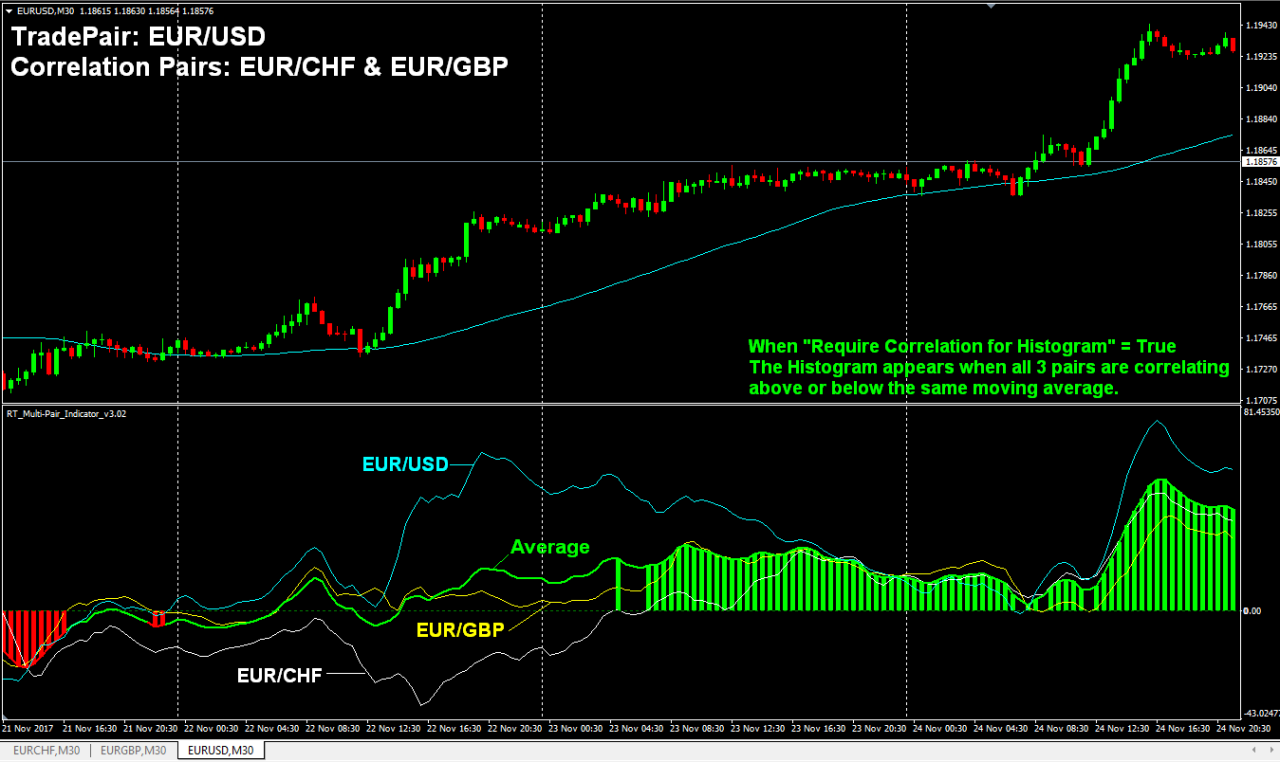
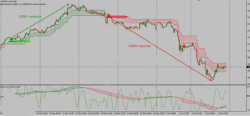
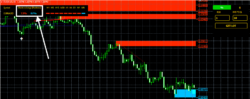
During a Down-Trend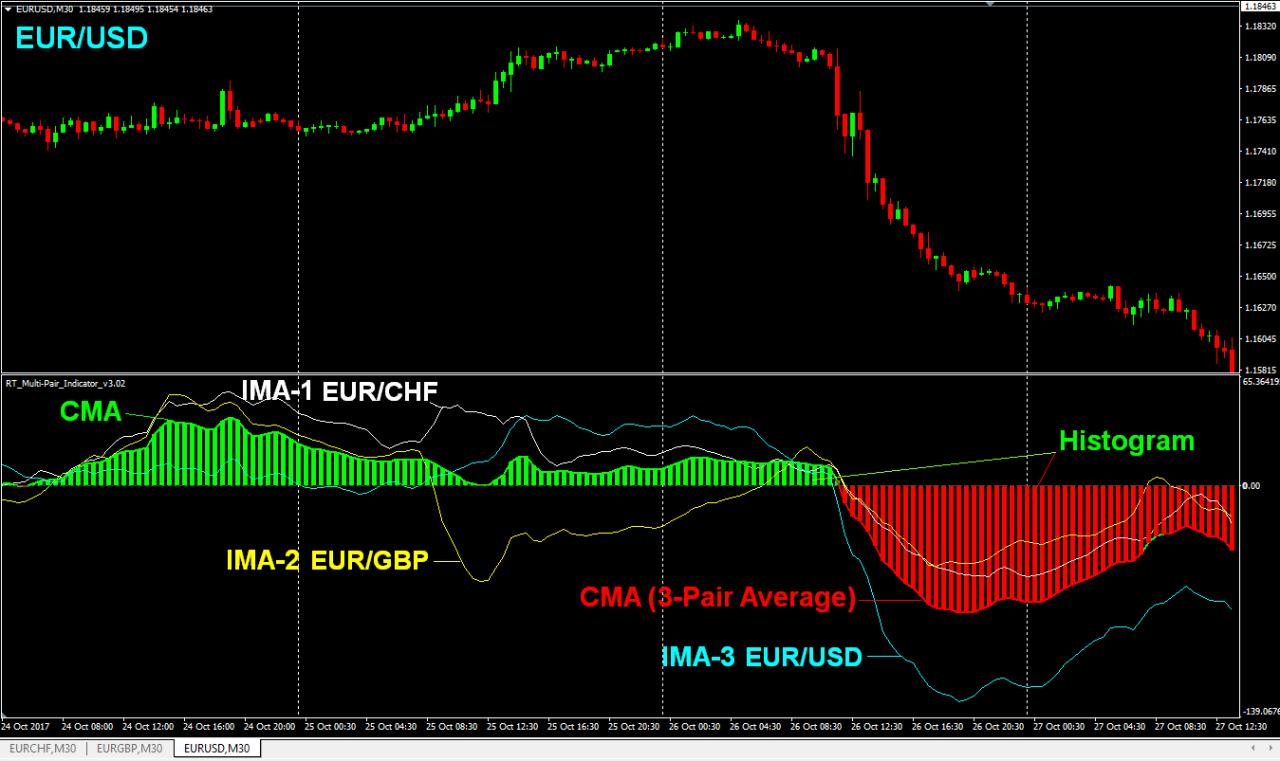
The CMA & Histogram show the combined
average of GBP/USD & USD/JPY on a GBP/JPY Chart