 SRC Indicator (MT4 Version)
 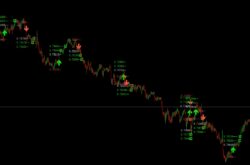 Scalping Indicators


Description
Footprint Pro
Forgot to mention put any number in the machine id field.
marketxero.com
See the auction action, not just the outcome
Candle charts show you what happened. Footprint Pro charts show you why, revealing the battle between buyers and sellers at every price level so you can spot absorption, exhaustion, and trapped participants before the move happens.
Divergence Detection
Automatically flags when aggressive delta fails to move price, exposing hidden absorption and potential reversals.

Volume Imbalance Zones
Stacked volume imbalance zones extend into future bars, marking areas where one side overwhelmed the other and may defend again.

Zero Print Zones
Price levels where one side of the auction had zero volume, forming support/resistance, or indicating exhaustion at HOD/LOD.

POC & Value Area
Instant identification of where the market found acceptance (POC) and fair value boundaries (VAH/VAL) within each bar.

Delta Percentage
When a significant delta % is one-sided, it’s a potential signal that stops triggered and/or that a large participant is moving price.

Context that’s actionable
See today’s price action in the context of the previous day. Volume Profile Pro carries forward the levels that matter: POC, Value Area, and Low Volume Nodes, helping you see at a glance if price is consolidating in range or in a longer-term trend.
Low Volume Nodes
5 evidence-based sensitivity presets identify liquidity gaps where price accelerates, breakout levels hiding in plain sight.

Previous Day Extensions
POC, VAH, VAL, and LVNs extend into the current session and terminate when tested, all with a corresponding date stamp.

Delta Profile
See directional pressure at each price level, overlaid or side-by-side with total volume, and see which side of the trade is trapped or in control.

Market Trend Classification
Real-time label shows TRENDING, BALANCED, CHOPPY, or DEVELOPING, adjust your playbook before the first trade.

Key Levels Pro
Stop drawing the same lines every morning
Key Levels Pro automatically plots the structure most traders mark manually: previous day high/low/close, overnight range, weekly levels, and opening range, so you start each session with context already in place.
Previous Day Levels
PHOD, PLOD, and Prior Close appear automatically. Save 30 minutes or more each day by eliminating the need to draw these lines manually.

Overnight High/Low
ONH and ONL captured and extended into RTH, see where overnight traders established boundaries

Weekly Levels
Previous week high/low available for multi-day context, key reference points for swing or day trading setups.

Opening Range Bands
ORH and ORL marked after your configured duration (15, 30, 60 min), classic breakout structures.

Smart Termination
Lines terminate on first touch, at RTH close, or extend indefinitely. You control how long levels persist.