


Description
The Relative Strength Index ( RSI ) is a momentum indicatorused intechnical analysisthat measures the magnitude of recent price changes to evaluate overbought or oversold conditions in the price of any financial asset. The RSI is displayed as an oscillator (a line graph that moves between two extremes) and can have a reading from 0 to 100. The indicator was originally developed by J. Welles Wilder Jr. and introduced in his seminal 1978 book, “New Concepts in Technical Trading Systems.” Smoothie RSI Cloud ( SRC) is a hybrid version of that same standard which is a very powerful indicator that has every feature like the standard RSI , for example, it provides technical traders information aboutbullish and bearish price momentum, and it is often plotted in “Existed pane below”. An asset is usually considered overbought when the SRC is above 70 and oversold when it is below 30.
What is the advantage of SRC INDICATOR:
– Measures the magnitude of recent price changes to assess the overbought or oversold conditions of the price of any financial asset.
– Provides traders with information on bullish or bearish potential price momentum.
– Divergence detector in any financial market.
– Standard RSI calculation combined with weighted moving average (WMA) and smoothing period functions.
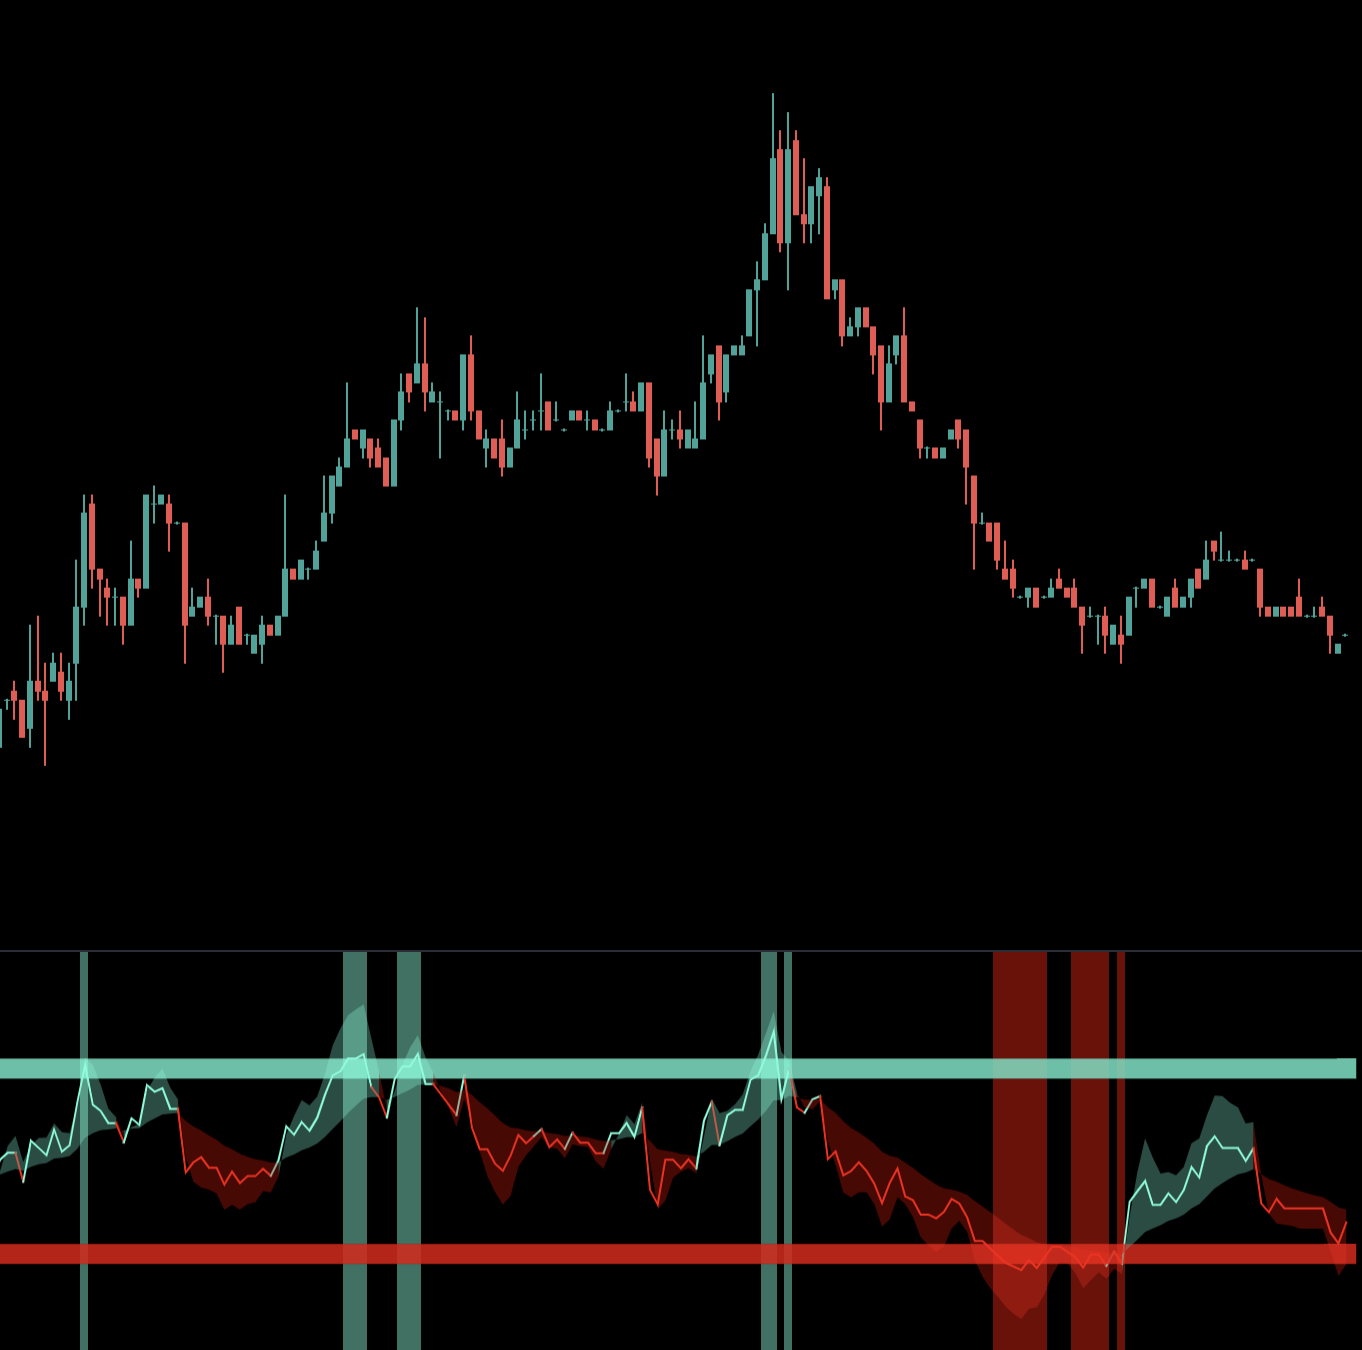
– Colored clouds informing market participants about the current market sentiment or the dynamics of the price of any asset.
– Vertical transparent colors above the SRC line, indicating the intersection of the SRC line above or below a certain threshold of the two extreme levels of the oscillator indicator.
Original website: https://assistant-bots.com/products/copy-of-src-indicator
Original Price: $89
WHAT’S THE BENEFIT OF USING SRC?
– Measures the magnitude of recent price changes to evaluate overbought or oversold conditions in the price of any financial asset.
– Provides technical traders with information about bullish a bearish potential price momentum.
– Divergence detector in any financial market.
– Standard RSI calculation in conjunction with weighted moving average ( WMA ) and Smoothing period functions.
– Beautiful coloured clouds that aware market players of the current market sentiment or momentum of any given asset price.
– Vertical transparent colors over SRCs line indicating SRCs line crossing above or below a certain threshold of two extremes levels of the oscillator indicator
SRC Indicator : The Relative Strength Index (RSI) is a momentum indicator used in technical analysis that measures the magnitude of recent price changes to evaluate overbought or oversold conditions in the price of any financial asset. The RSI is displayed as an oscillator (a line graph that moves between two extremes) and can read from 0 to 100. The indicator was originally developed by J. Welles Wilder Jr. and was introduced in his seminal 1978 book, “New Concepts in Technical Trading Systems.”
Smoothie RSI Cloud (SRC Indicator) is a hybrid version of that same standard RSI which is a very powerful indicator that has every feature like the standard RSI. For exampleit provides technical information about bullish and bearish price momentum, and is often plotted in “Existed pane below”. An asset is usually considered overbought when the SRC is above 70 and oversold when it is below 30.
A bullish divergence occurs when the SRC create an oversold reading followed by a higher low that matches correspondingly lower lows in the asset price. This indicates rising bullish momentum, and a break above oversold territory could be used to trigger a new long position. A bearish divergence occurs when the SRC creates an overbought reading followed by a lower high that matches corresponding higher highs on the price.