bollinger bands strategies
I have seen some of the indicators we are going to use for this strategy used in other places for trading. However, this is a comprehensive package, which could be a good tool when it comes to profitable financial market trading.
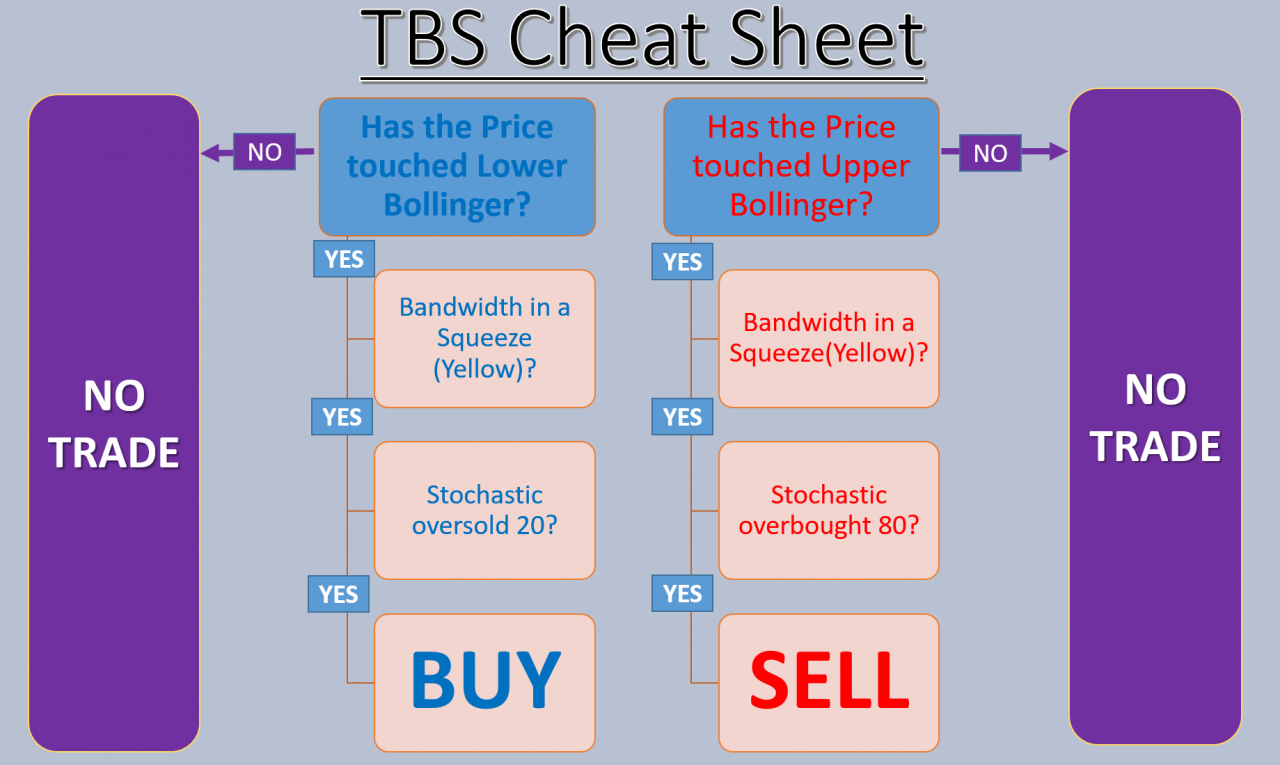
This Strategy is derived from the knowledge of three indicators. Bollinger band, Bollinger Bandwidth and the Stochastic oscillator. The three indicators must all confirm our trade signal. So to have a valid signal, three conditions must be met.
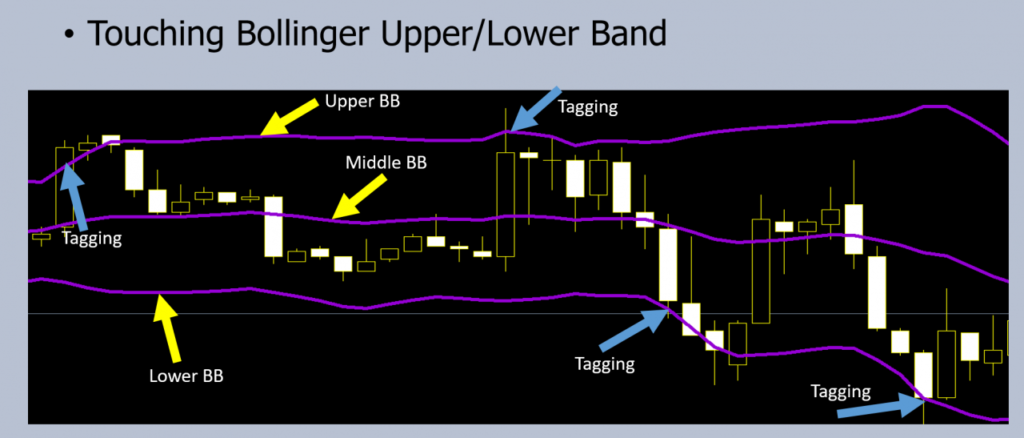
Condtion 1: Touching Upper/Lower Bollinger Band
When prices reaches a high level they will touch the upper band. When prices reaches lower levels, they will touch the lower band. So to have a valid trade, prices must touch either the upper or lower band.
Attached Image (click to enlarge)

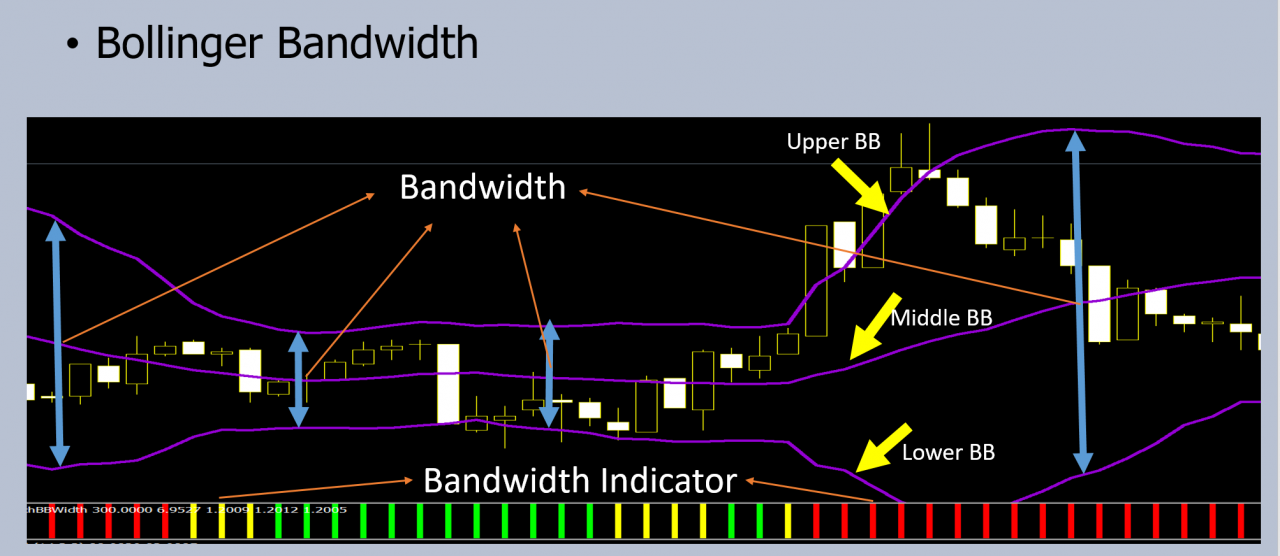
Condition 2: Bollinger Bandwidth measured by the Bandwidth Indicator
The bandwidth is the difference (gap) between the upper band and the lower band.
This Bandwidth indicator takes the current Width of the Bollinger Bands and compares it to the Maximum and Minimum Width of the Bands over N periods
If the calculated percentage is less than or equal to X Percent (which we will specify), then the histogram shows yellow. If the calculated percentage is greater than the X Percent, then the histogram shows Red.
This works out well to quickly see if the currency pair is ranging (Yellow) and if it has broken out of range (Red)
To have a valid trade, the bandwidth indicator must be Yellow which means prices are contained within a tight range. This give us the opportunity to be able to trade inside the band picking top and bottom of the range with the help of the Stochastic indicator.
Attached Image (click to enlarge)
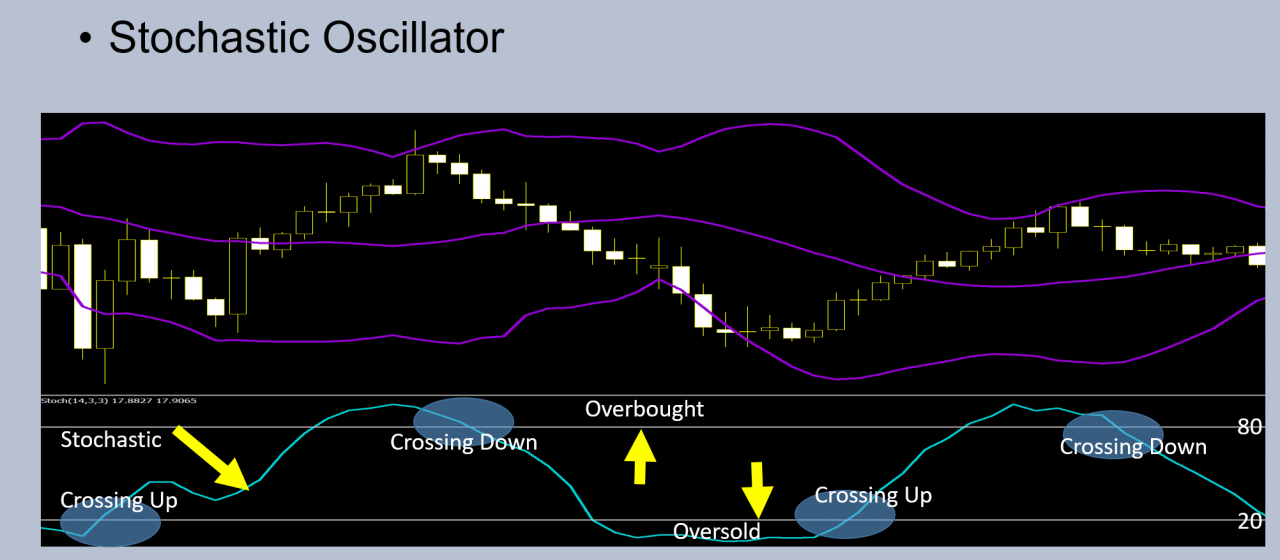
Condition 3: Stochastic Oscillator
Stochastic indicator usually has two horizontal lines, one at 20 and one at 80. The 20 line is called the oversold level and the 80 line is referred to as overbought level. To have a valid BUY signal, stochastic must have been in the oversold territory and crossing the 20 line upward. To have a valid SELL signal, Stochastic must have been in the overbought territory and crossing the 80 line downward.
Attached Image (click to enlarge)
Putting it together For a BUY Signal
Once price has touch the lower band, you will check the Bandwidth indicator. The Bandwidth indicator must shows that the price is in a range (Yellow Colour), You will then wait for Stochastic to confirm the trade. Stochastic indicator will have to cross the 20 line upward from the oversold territory.
Putting it together For a SELL Signal
Once prices has touch the upper band, you will check the Bandwidth indicator. The Bandwidth indicator must shows that the price is in a range (Yellow Colour), You will then wait for Stochastic to confirm the trade. Stochastic indicator will have to cross the 80 line downward from the overbought territory.
Attached Image (click to enlarge)
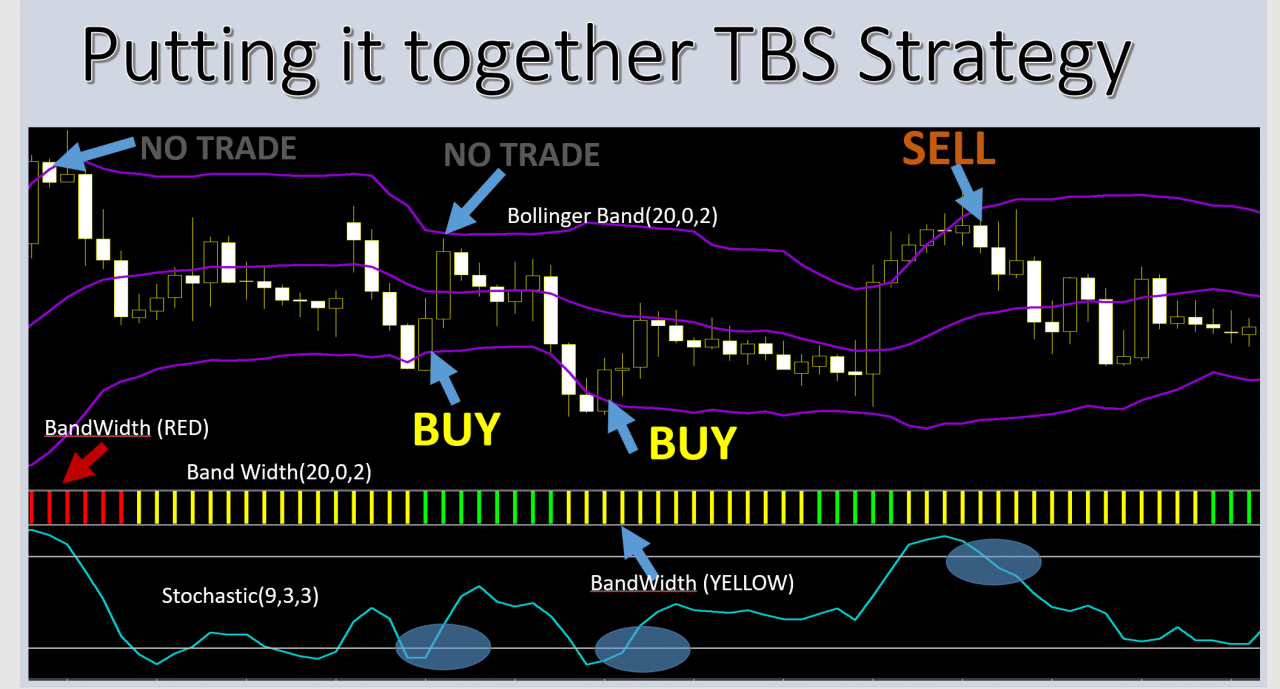
In Summarry
Attached Image (click to enlarge)
The three indicators required are Bollinger Band (Included in Metatrader), Bollinger Bandwith (custom indicator, attached), and Stochastic Oscillator (Included in Metatrader). Here are the settings:
Bollinger Band
Period – 20 , Shift – 0, Deviation – 2, Set to ‘close’
Bollinger Bandwidth
Period – 20 , Shift – 0, Deviation – 2, Width Calculation Period – 100
Min Range Percent – 20
Stochastic
%K period – 9, find it below:
%D period – 3
Slowing – 3
Price field – Low/High
MA method – simple
The Bandwidth indicator and the template attached.
If you will like to see a video explanation of the strategy, here it is:
Inserted Video
And finally, an example of a trade taken using this strategy, here it is:
Inserted Video
You can ask any question or comments either here in this forum or on the YouTube page.
Happy trading.


Responses