Double Stochastic RSI Indicator

Stochastic (Stochastic) iRSI – These classic oscillators are the best choice for trading reversals. Stochastic and RSI have one feature in common: they both show overbought or oversold areas in any market, either daily/weekly or intra-day. Their formulas are different, and Stochastic is less sensitive than RSI. which is better, RSI or Stochastic? Which one should I choose? The Double Stochastic RSI indicator allows you to use both at the same time.
 The indicator automatically analyzes price dynamics to identify overbought or oversold areas.
The following components make up the indicator.
The main line, whose values range from 0 to 100.
Two dynamic levels of overbought or oversold.
How to interpret the Stoch RSI indicator?
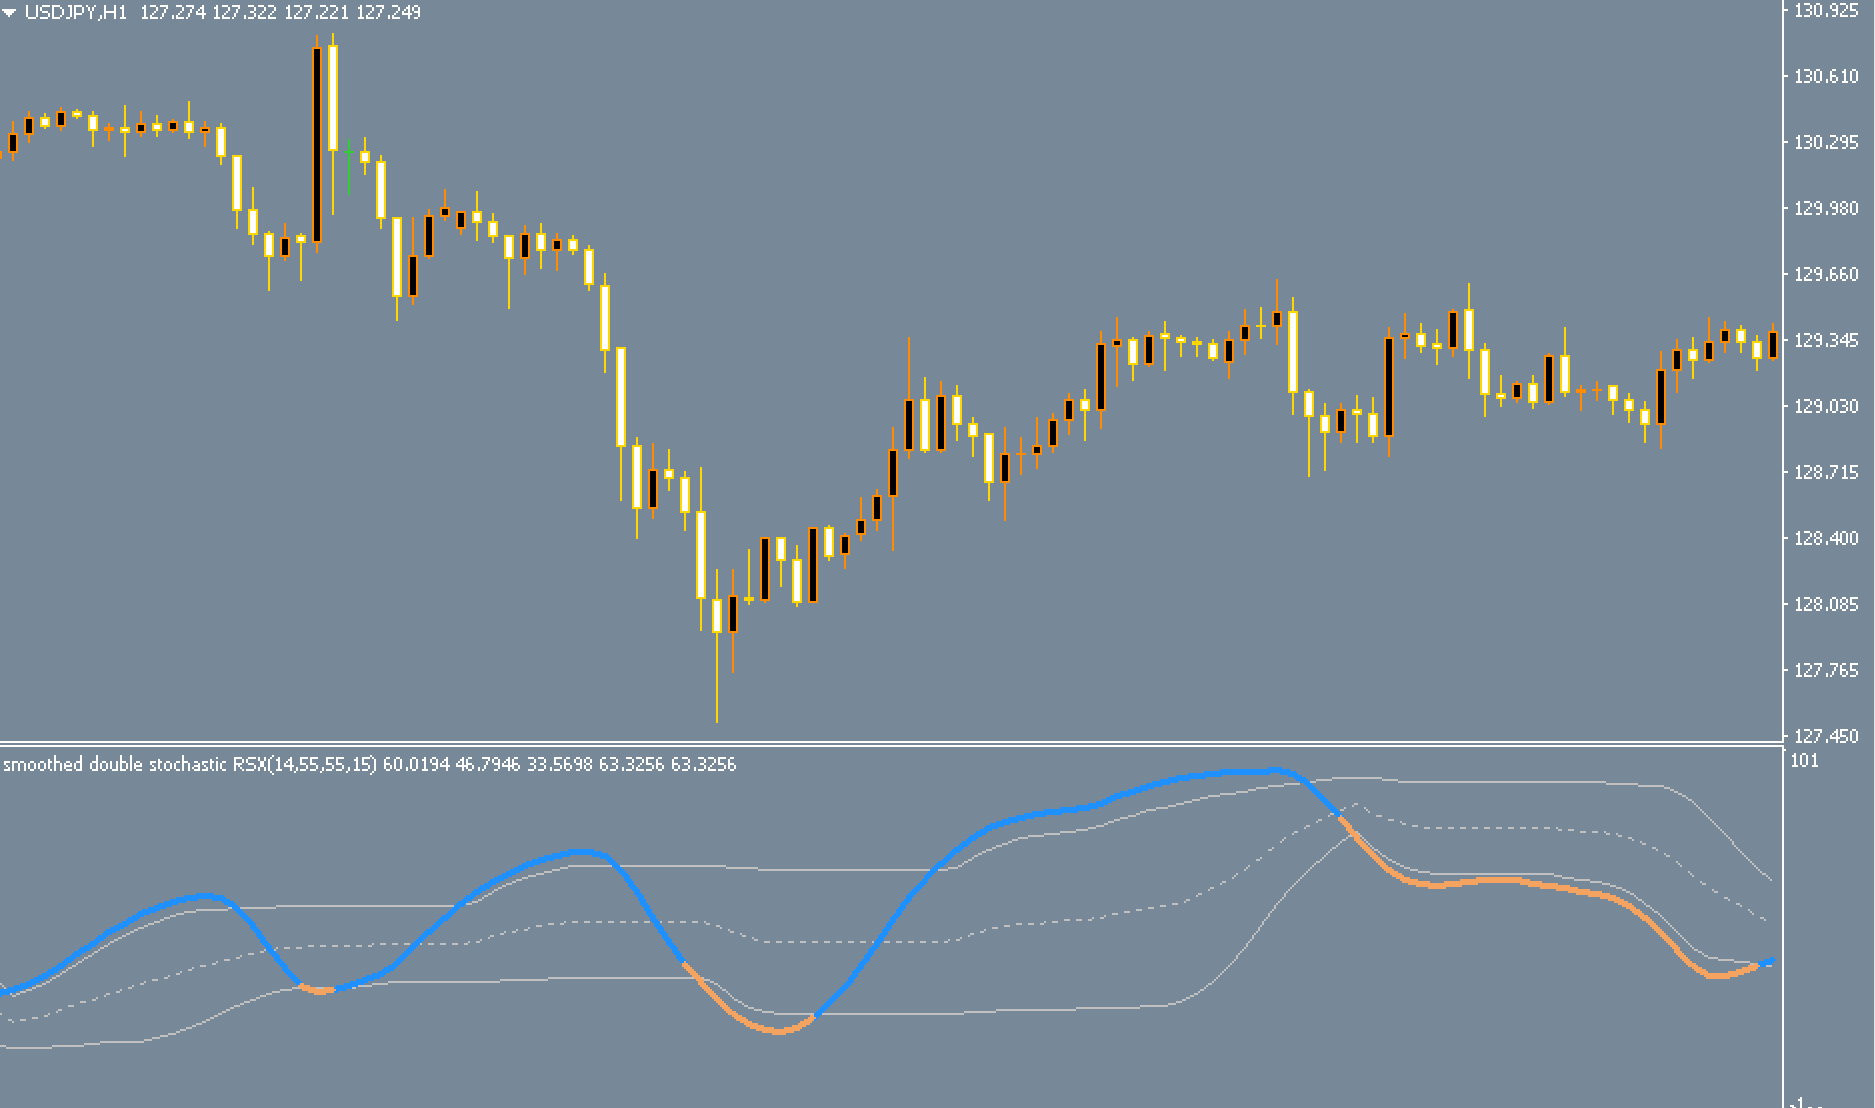
If the value exceeds the overbought limit, the main line will turn blue. You can change the color according to your needs. This can be interpreted in one of two ways.
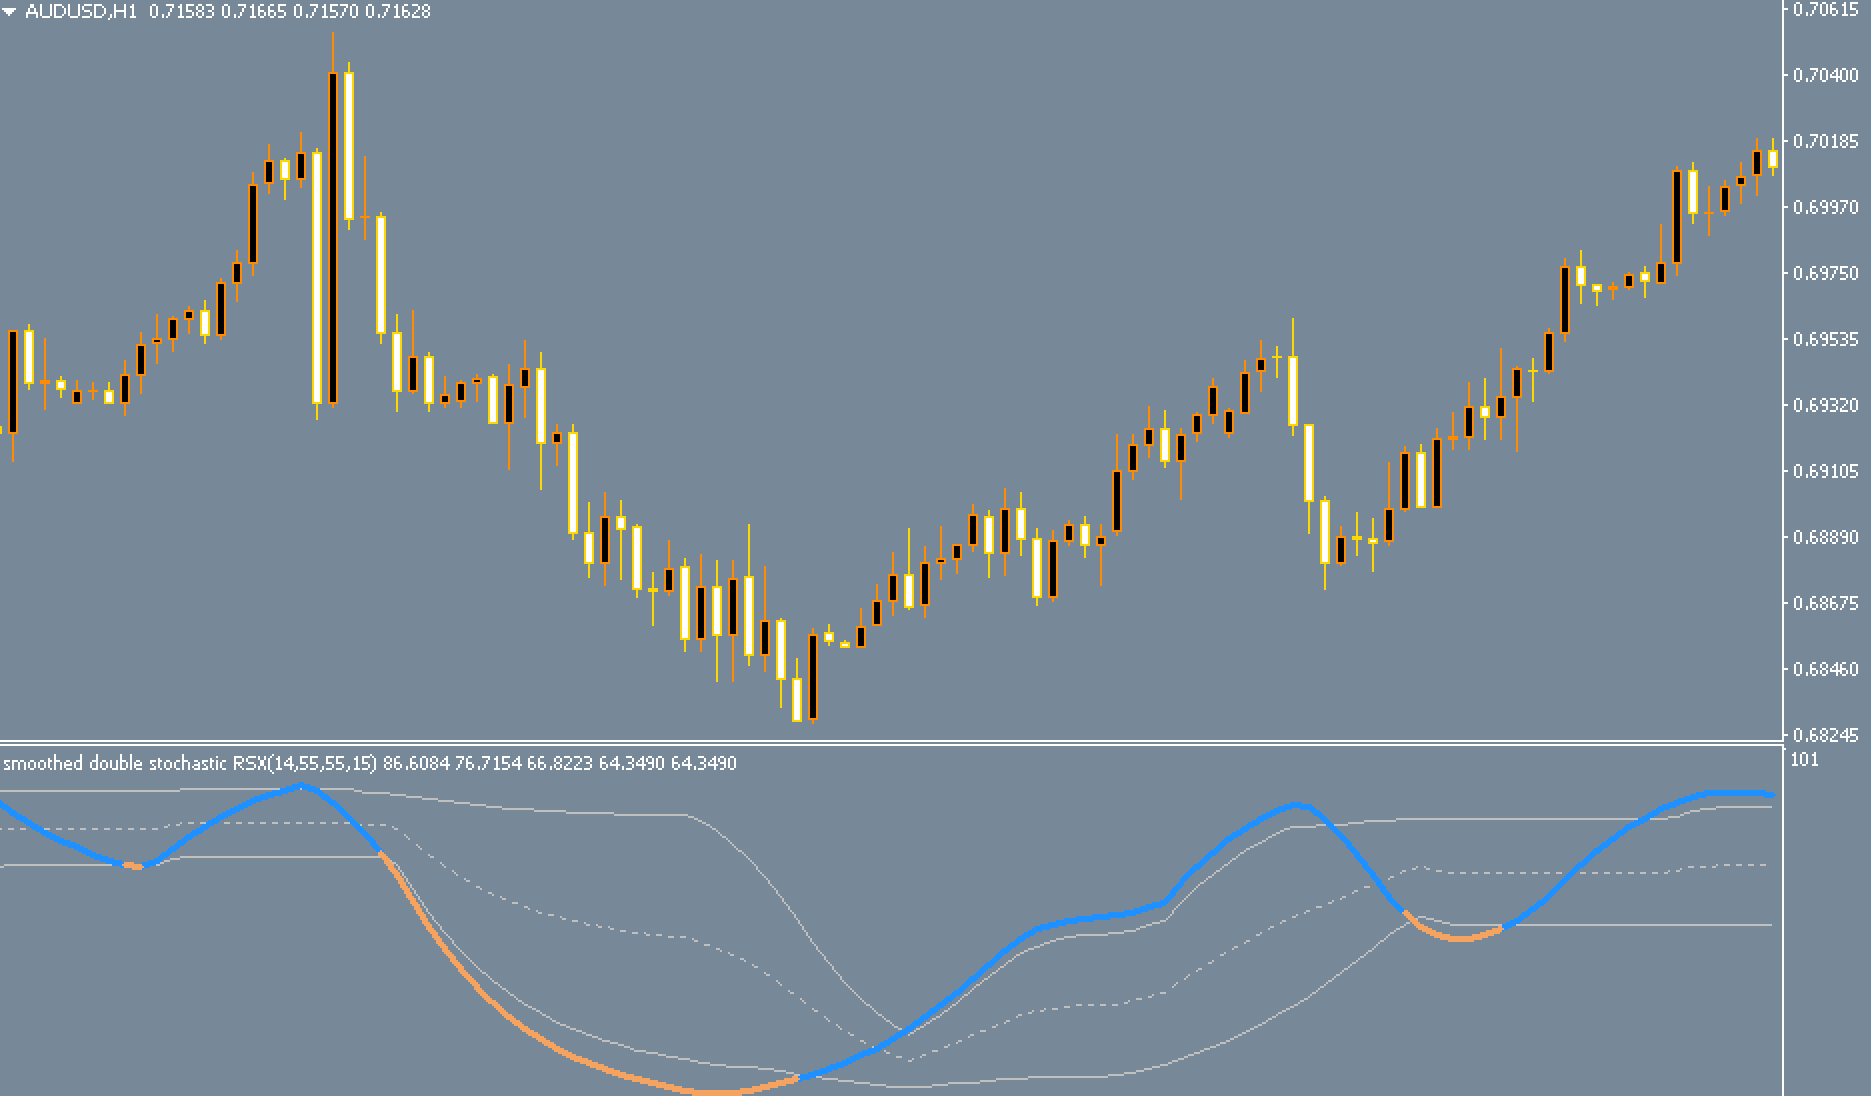
Either when the price is high.
Or as a result of a bullish trend that has been going on.
If the Double Stochastic RSI indicator drops below the oversold level, the main line will turn orange. This can be interpreted as a long term bearish trend or a period when prices are too low.
How accurate is the Double Stochastic RSI?
Unfortunately, or fortunately for those who struggle to earn intraday income, there is no magic arrow indicator that guarantees profitable buy and/or sell signals. If you expect to make a 5:1 profit, then the Double Stochastic RSI indicator is not for you.
You can set a stop loss under the previous local low in the traditional way. Profits can be taken when there is a counter signal (marked by the second arrow) or other signs indicating danger.
The Double Stochastic RSI indicator signals entry into a short-term position when the main line leaves the overbought zone and changes color to gray (marked by an arrow).
You can set a stop loss above the local high. Profits can be made when there is a counter signal (indicated by an arrow on the chart) or when using your preferred money management method.
Summary
The Stochastic RSI indicator combines two traditional oscillators to find overbought or oversold areas.