

Description
There is a proper way to trade with the RSI and what the world teaches you. Most forums, gurus and websites teach you that overbought and oversold levels are 70 and 30 respectively. when prices reach these levels you should expect a bounce. Correct? – Wrong!
That’s what the world teaches you, so they know where the massive buy and sell volume is coming from. Who ever said the magic number 70 was an oversold level and 30 was an overbought level, right?
How do you know this secret RSI trading strategy?
Having a different way of looking at the RSI can really improve your profitability.
Now, this can be used as a trading strategy on its own, but is best used in combination with other strategies (especially Fibonacci and Support & Resistance).
How does this RSI trading strategy work?
So the trick is to find the true RSI level at which the price bounces. This could be 60, not 70. instead of 30, this could be 40. this is the true RSI of the market. Here is a screenshot of how our special True RSI indicator works to find the key level of a price rally.
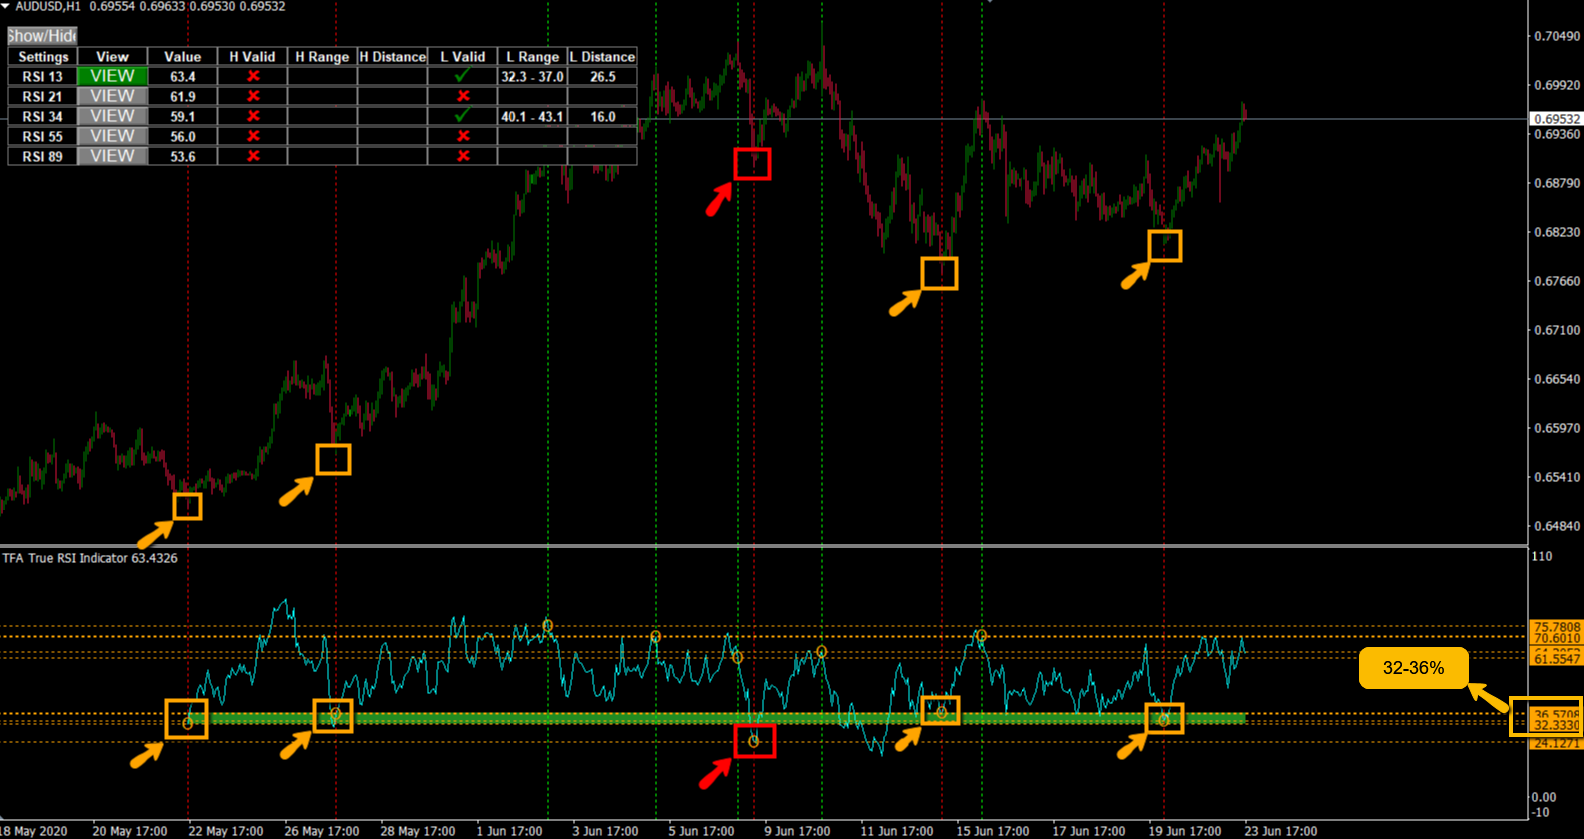
As you can see in the image, the RSI indicator has scanned 5 major swing lows that bounced very well (we can adjust the sensitivity and the tightness of these big swing lows). So, 4 out of the last 5 times price has bounced well – coinciding with the RSI being at 32-36% (4 orange boxes indicate how well it bounced and 1 red box indicates it did not).
So what does this tell us?
It means that when the RSI reaches the 32-36% level, there is about an 80% chance of a price rebound. With this strategy itself, we already have a market-leading edge in terms of trading and making money (really? Yes! . However, if you want to really increase your trading profitability, you can add basic support and resistance, or even Fibonacci.
Test up to 5 RSI values at a time in the indicator. This will allow the TFA True RSI Indicator to scan for bounces of multiple RSI cycle values and the table will show if there are hidden true RSI levels on the chart.
As you can see in the chart above, we are scanning 5 RSI settings (13, 21, 34, 55, 89) and our Real RSI indicator will show us which area has a valid hidden RSI zone level.
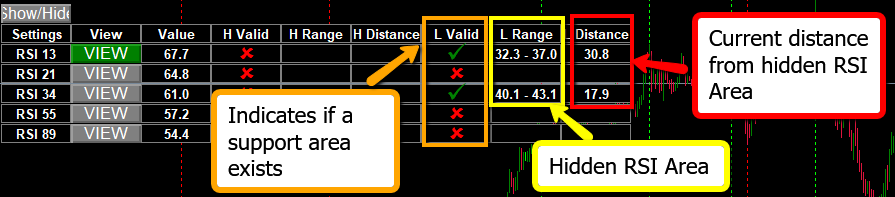
The following is an explanation of the various settings.
Settings: These are the various RSI settings we are testing (up to 5 at a time)
View.
Clicking this button will load the RSI and hidden regions. We usually only click View when there are valid hidden RSI regions.
H Valid.
Highly valid means that there is a hidden RSI swing high resistance area (when we are playing down instead of bouncing).
H Range.
Shows the range of the hidden RSI area for this hidden RSI swing high resistance.
H Distance.
Displays the distance from the current RSI to the hidden area. Smaller numbers indicate closer distance.
L Valid.
Low valid means there is a hidden RSI Swing Low support area (where we play bounce from).
L Range.
Shows the range of the hidden RSI area where the hidden RSI Swing Low support is located.
L Distance.
Shows the distance of the current RSI to the hidden area. Smaller numbers indicate closer distance.
Let me show you what it looks like.
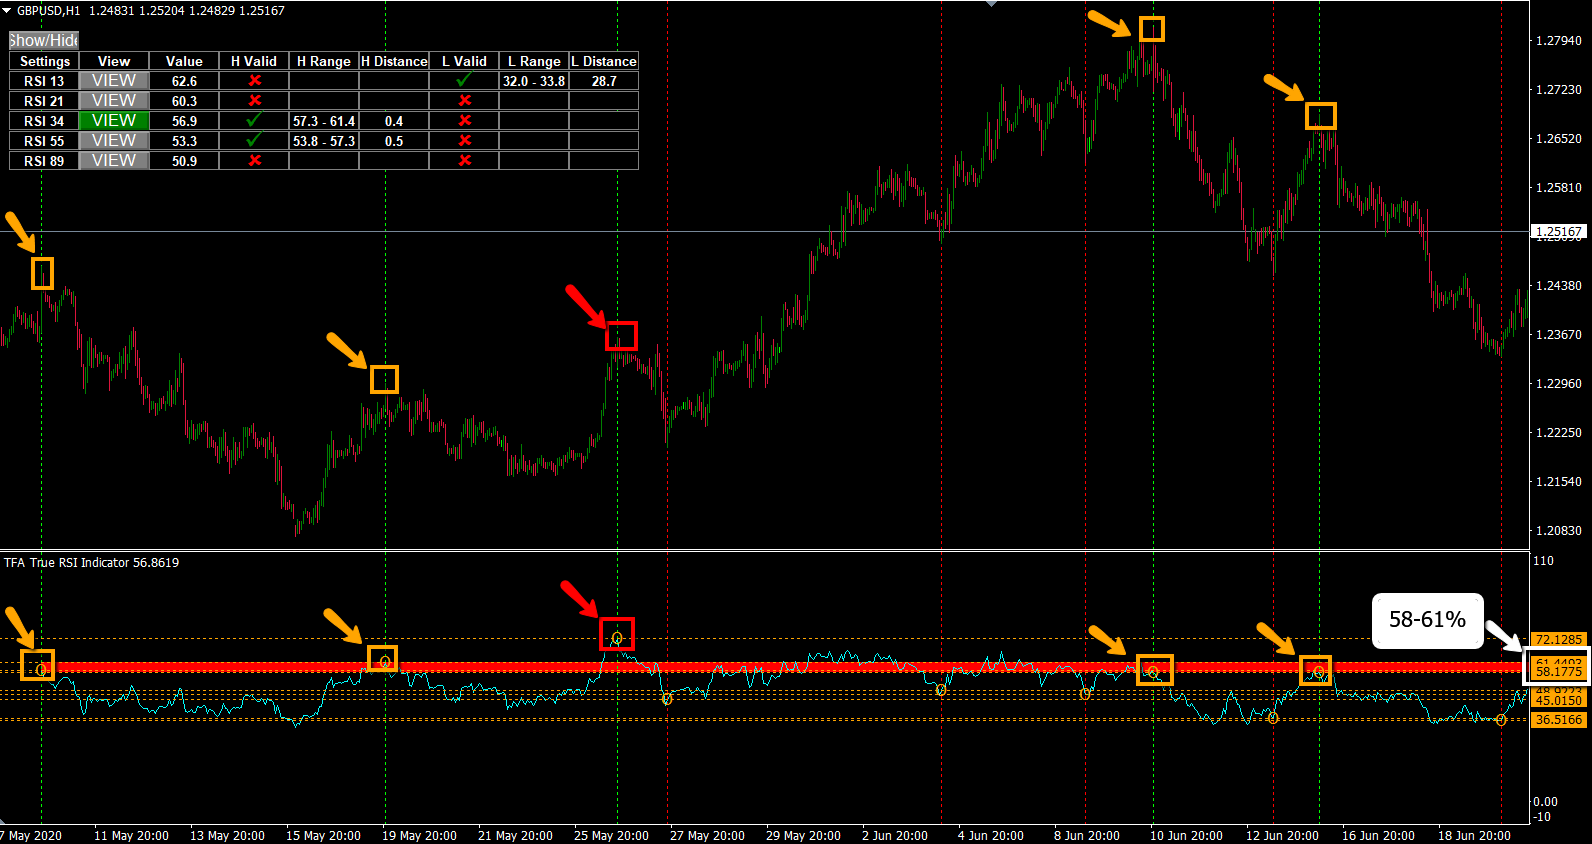
As you can see in this photo. We used the same 80% confidence criteria with a sample size of 5 and found a hidden area of RSI resistance between 58-61% (very different from the 70% most people tell you!) . The orange arrow + box shows where the valid reversal occurred. The red arrow + box shows 1/5 times that the reversal was not correct. So, with 4 orange (valid) and 1 red (invalid), this still gives us an 80% confidence level standard.
With this approach, you can greatly improve any trading strategy you have by identifying high probability reversal levels.