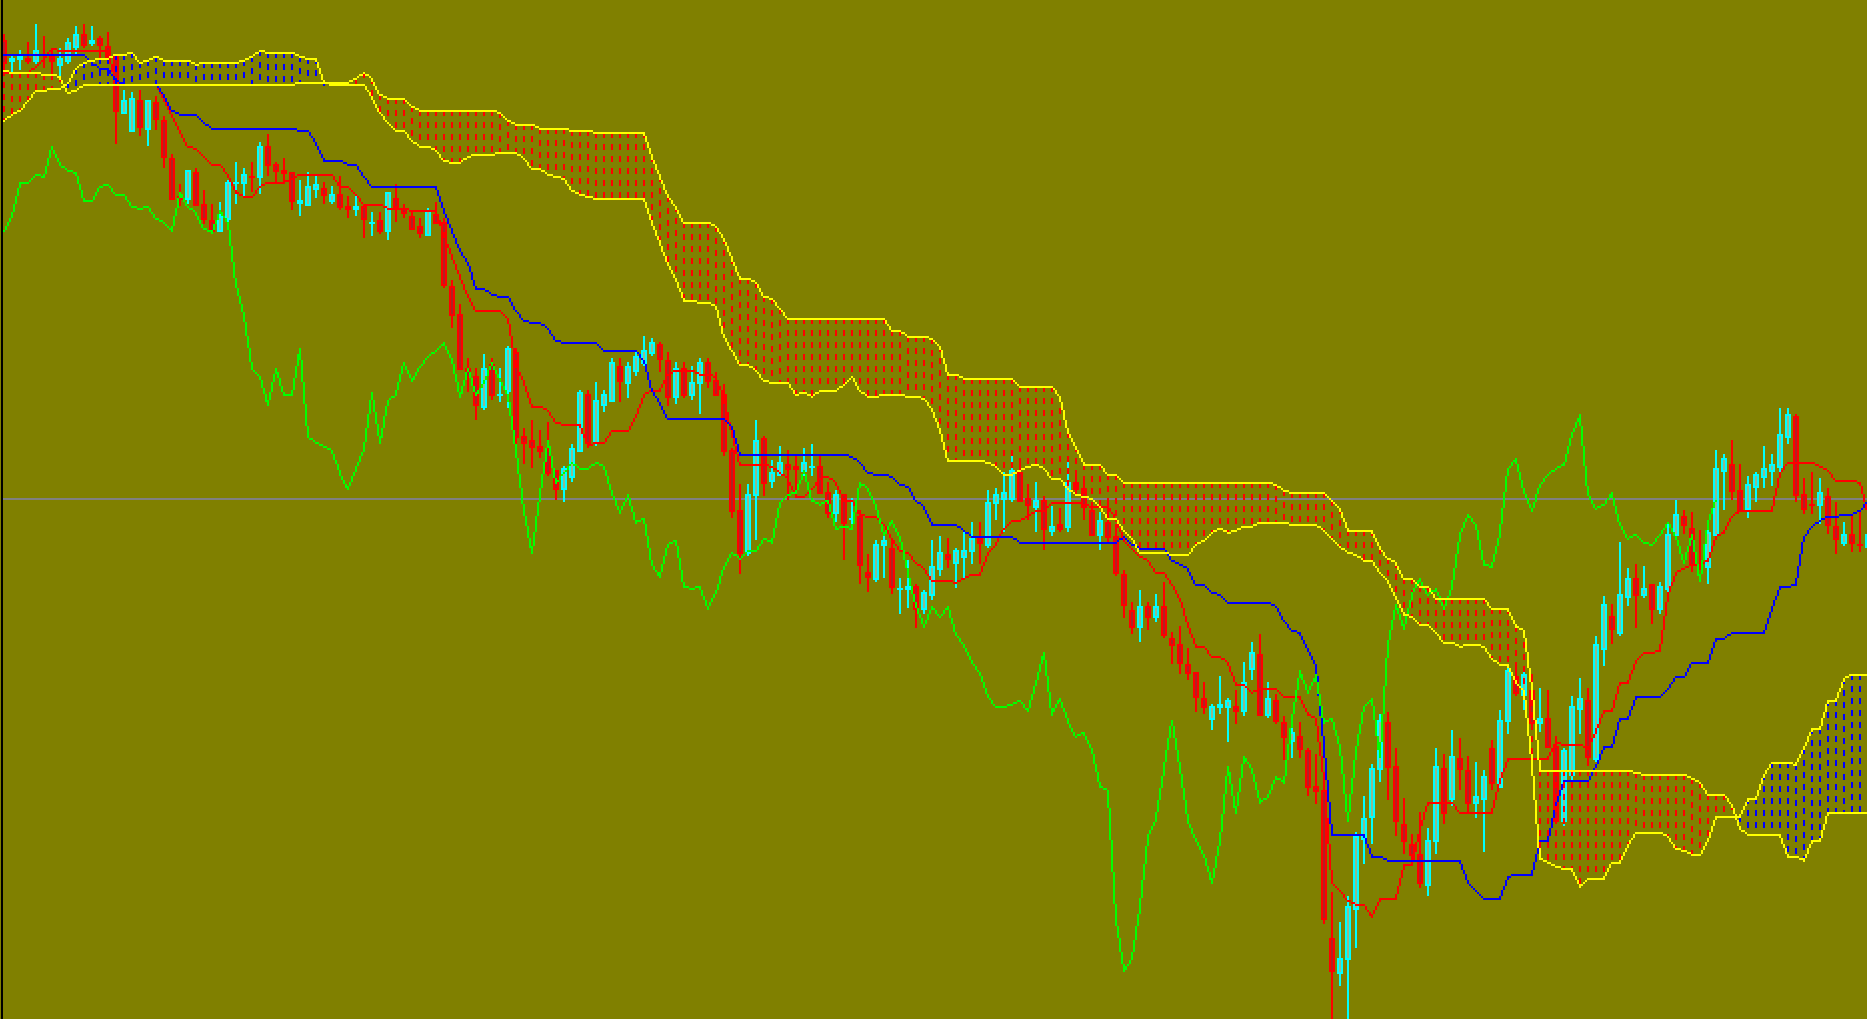
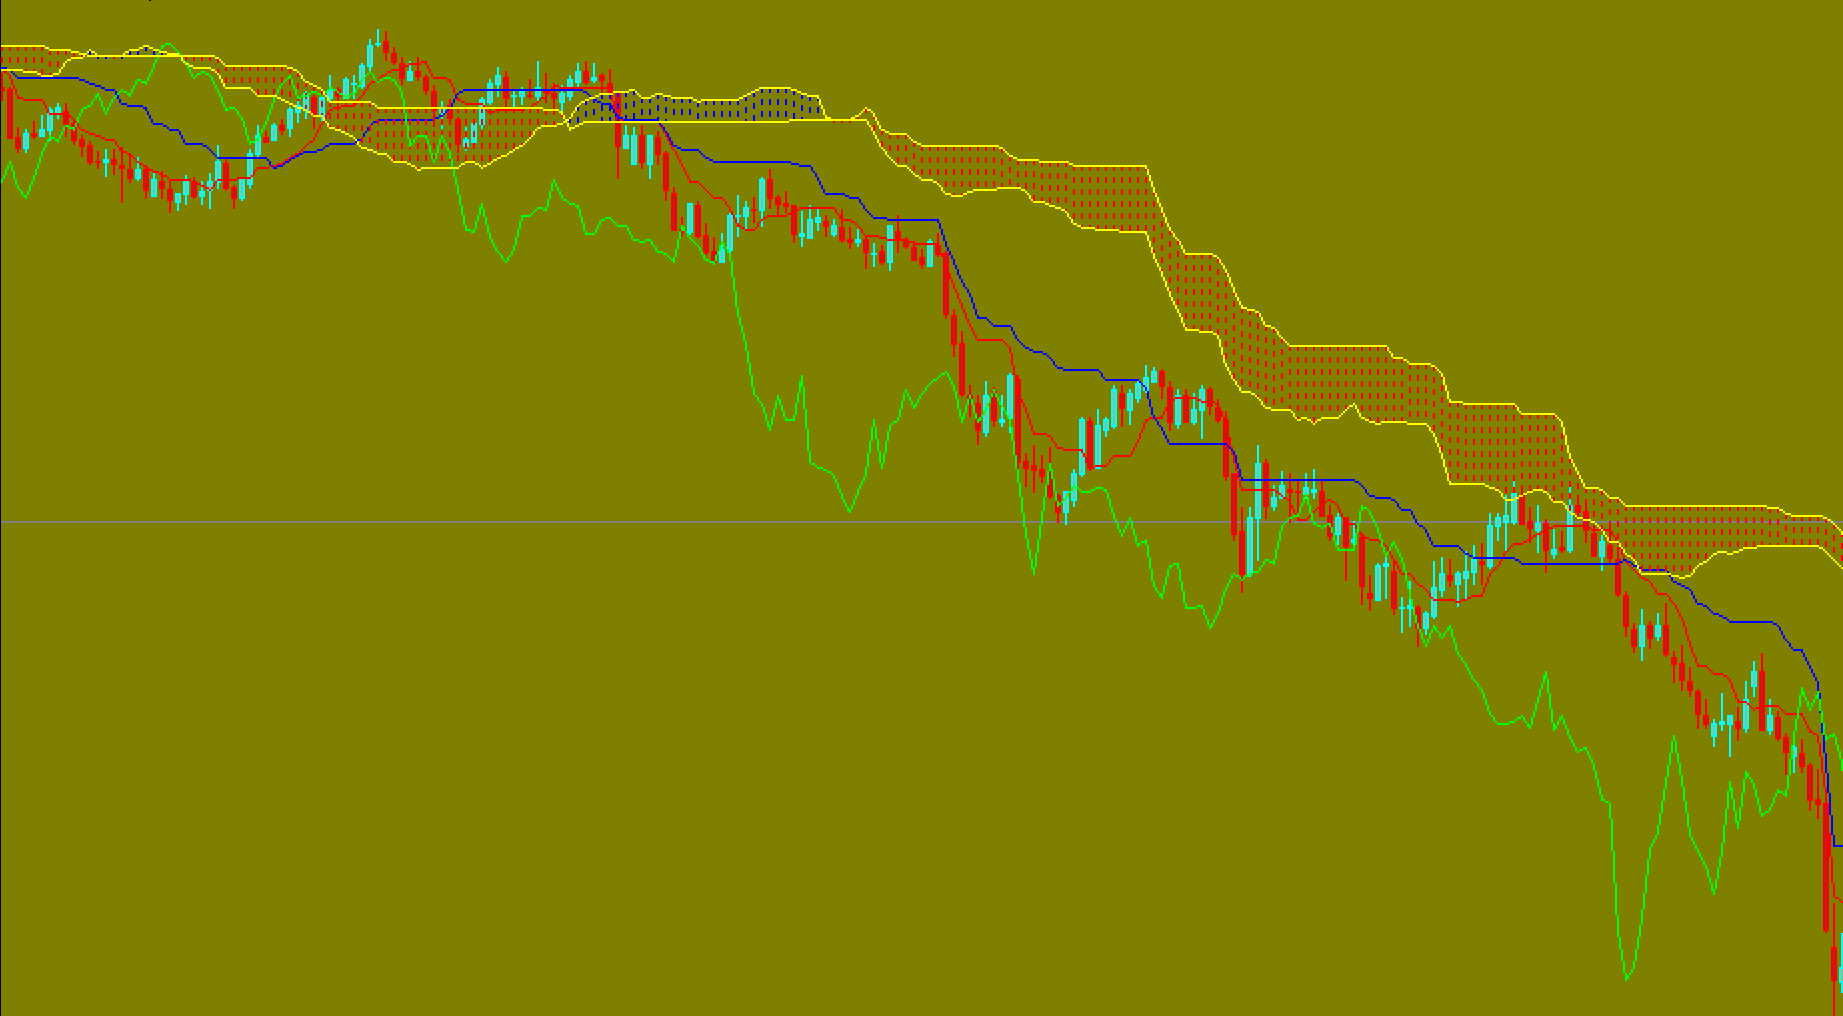
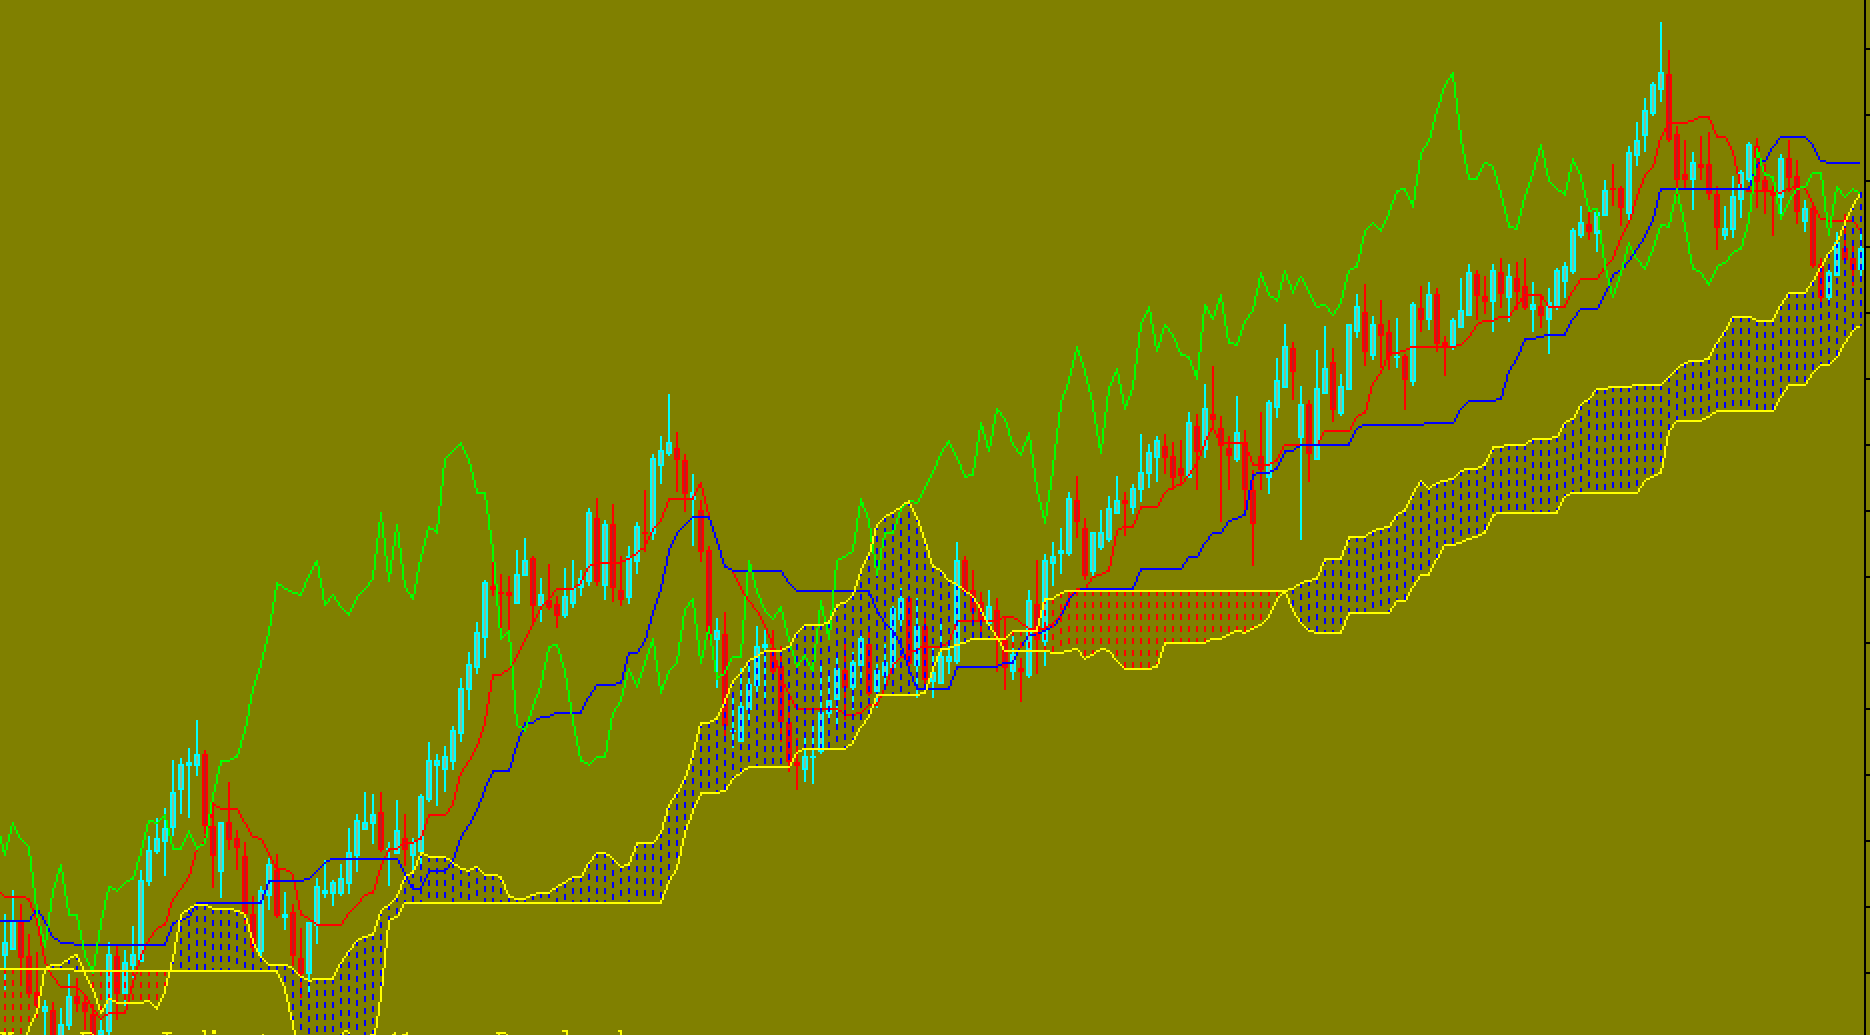
The Ichimoku Kinko Hyo technical indicator is predefined to identify the market trend, support and resistance levels and generate signals for buying and selling. This indicator is best used on weekly and daily charts.
Four time intervals of different length are used to define the dimension of parameters. These intervals are used to determine the values of individual lines in this indicator.
- Tenkan-sen is the average price value for the first time period. This is the sum of the maximum and minimum prices within the time span, divided by 2.
- Kijun-sen displays the average price value for the second time interval.
- Senkou Span A depicts the middle distance between two lines, shifted forwards using the second interval value;
- Senkou Span B displays the average price value for the third time interval, shifted forwards from the second time interval.
Chikou Span displays the closing price for the current candle, shifted backwards according to the second interval. The distance between the Senkou lines can be hatched with a different color, called “cloud”. If the price falls between these lines, then the market should not be considered to be in trend. The cloud margins are the support and resistance levels.
- If the price is higher than the cloud, the upper line of the support level forms the first level and the second line the second level.
- If the price is below the cloud, the lower line will be the resistance level. The upper one will be the second.
- It is signal to buy if the Chikou Span lines crosses the price chart in the top-down direction. It is signal to buy if the Chikou Span lines traverse the price chart in the direction of the top-down.
Kijun-sen can be used to indicate market movements. The price will likely continue to rise if it is higher than the indicator. The trend can change further if the price crosses this line. The Kijun-sen can also be used to give signals. When the Tenkan-sen lines traverse the Kijun-sen, it is a signal to buy. Sell signals are generated in the top-down direction. Tenkan-sen can be used to indicate market trends. The trend is defined by the line’s movement. If it moves horizontally it is a sign that the market has entered the channel.
What is the Ichimoku Kinko Hyo Indiator?
Goichi Hosoda (a Japanese journalist) developed the Ichimoku Kinko Hyo indicator in the 1930s. His technique was perfected for 30 years before he made it public in 1960.
The Ichimoku Cloud Indicator (also known as Ichimoku Kinko Hyo) is a versatile manual forex trading indicator. It defines support levels, resistances, determines the direction of trend, measures momentum, and provides trading signals for forex.
This trading system works with all time frames and any instrument. This indicator provides traders with an in-depth understanding of different markets. It helps them identify a variety of trading opportunities with high probability. In just a few seconds, we can determine if a trade following the current trend in the pair is positive or negative.
Ichimoku can show either uptrends and downtrends. If there is not a clear trend, this indicator should be avoided.
The Ichimoku Kinko Hyo Indicator’s components
Ichimoku Kinko Hyo’s indicator is made up of several different graphical elements that are arranged on one chart. These elements help us to identify the support or resistance . These elements can also be used to determine if the market trend is occurring or if it is consolidating. These are the components of the Ichimoku indicator.
The Kumo or Cloud
The Senkou Span A and Senkou Span B lines make up the cloud.
The cloud’s main purpose is to detect trends.
- Signals:
- If the SSB is lower than the SSA, then the trend is bearish
- Bullish when the SSA is greater than the SSB.
- If the price fluctuates in the cloud, it means that we are in a lateral range.
- Market volatility is minimal if the cloud is thin
- Market volatility is high when the cloud is large.
The Tenkan, also known as the Fast Line
Tenkan’s function is to inform you about price volatility (being the nearest median to the price).
Tenkan Interpretation:
- Tenkan rising means that the highs or lows of the 9 previous candles are rising.
- Tenkan will go down if the highs or lows of the 9 previous candles are lower.
- The Tenkan line will remain flat if the market falls or rises.
- This line is the most responsive in the Ichimoku Kinko Hyo System. This average doesn’t shift to the right and left like the Chikou average.
The Kijun Sen or Slow Line
Its purpose is to provide information about long-term volatility and reflect the price.
- Interpretation:
- If the Kijun rises, that means the highs or lows of the 26 candles in the past 26 days are increasing.
- If the Kijun falls, that means the highs or lows of the 26 candles in the last 26 days are decreasing.
- The Kijun line remains flat if the market falls or rises.
The Chikou or Delay Line
Chikou represents the price action over the past 26 periods. It is the mirror image, but with 26 periods of forward movement.
This allows us to compare the price situation today with 26 years ago. An analysis of the Chikou in relation to other levels can confirm a new trend.
This line of Ichimoku Kinko Hyo Forex is the only one that isn’t based on Donchian Channel.


