

Description
Use the Forex Renko Zoomer strategy to drive your charts to generate profits Apply the best accuracy indicators to your offline charts designed with custom settings to take the best time to buy and sell signals!
Features.
Our own built offline chart builder tool available as an indicator.
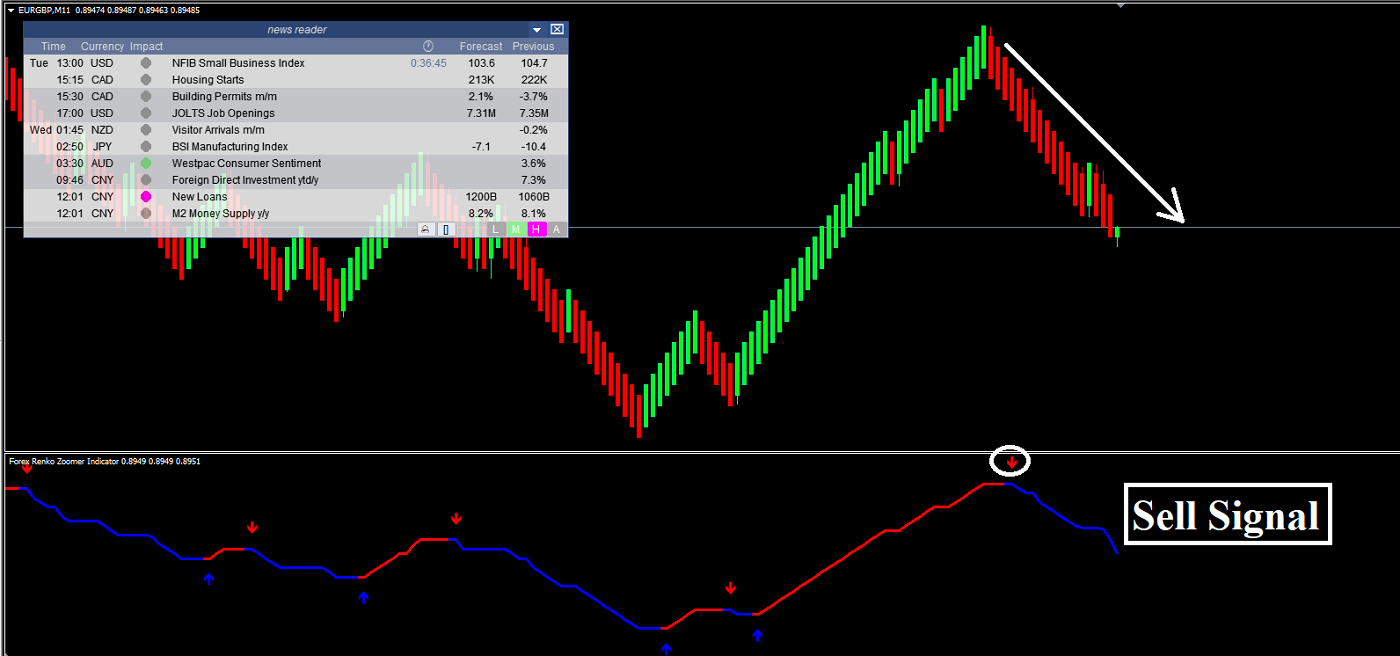
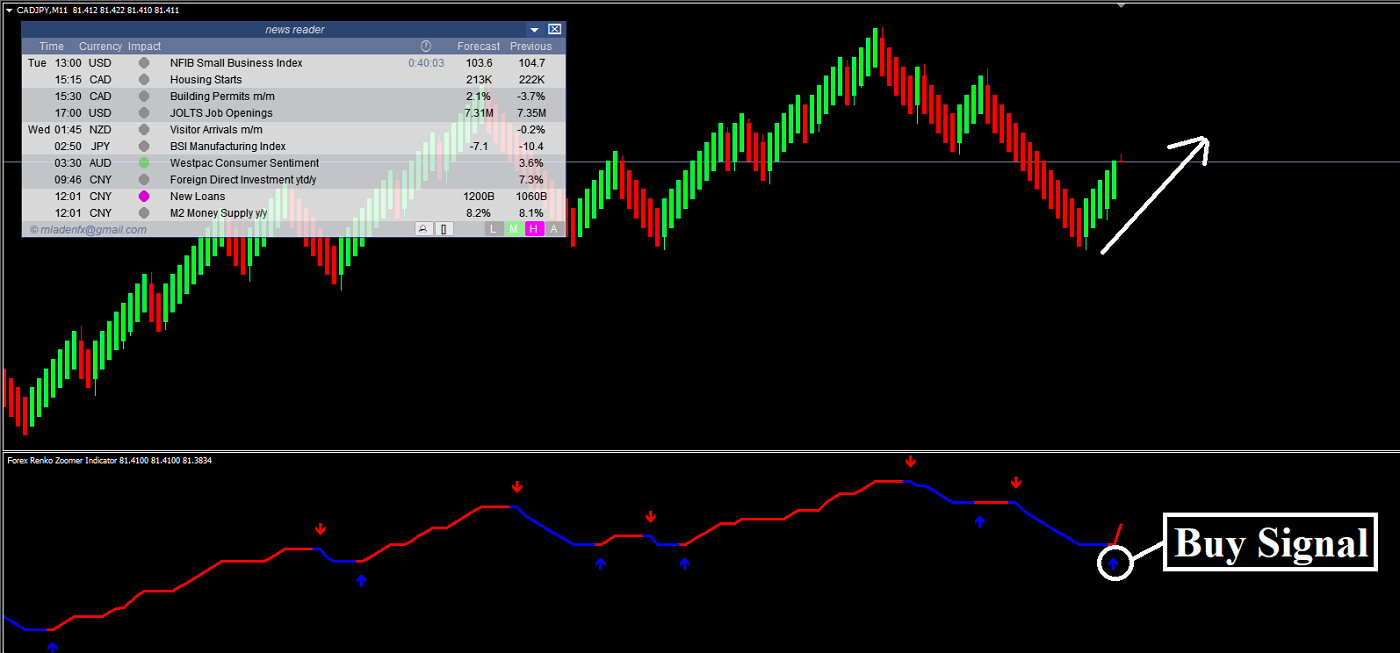
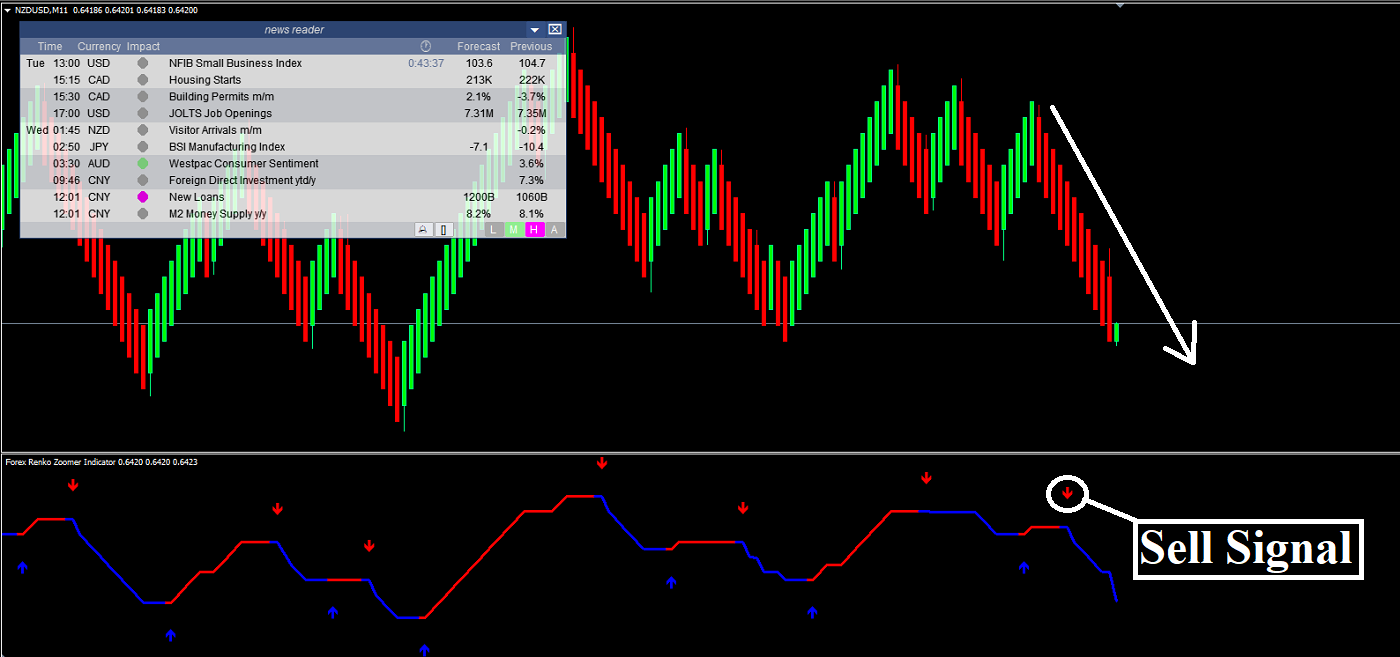
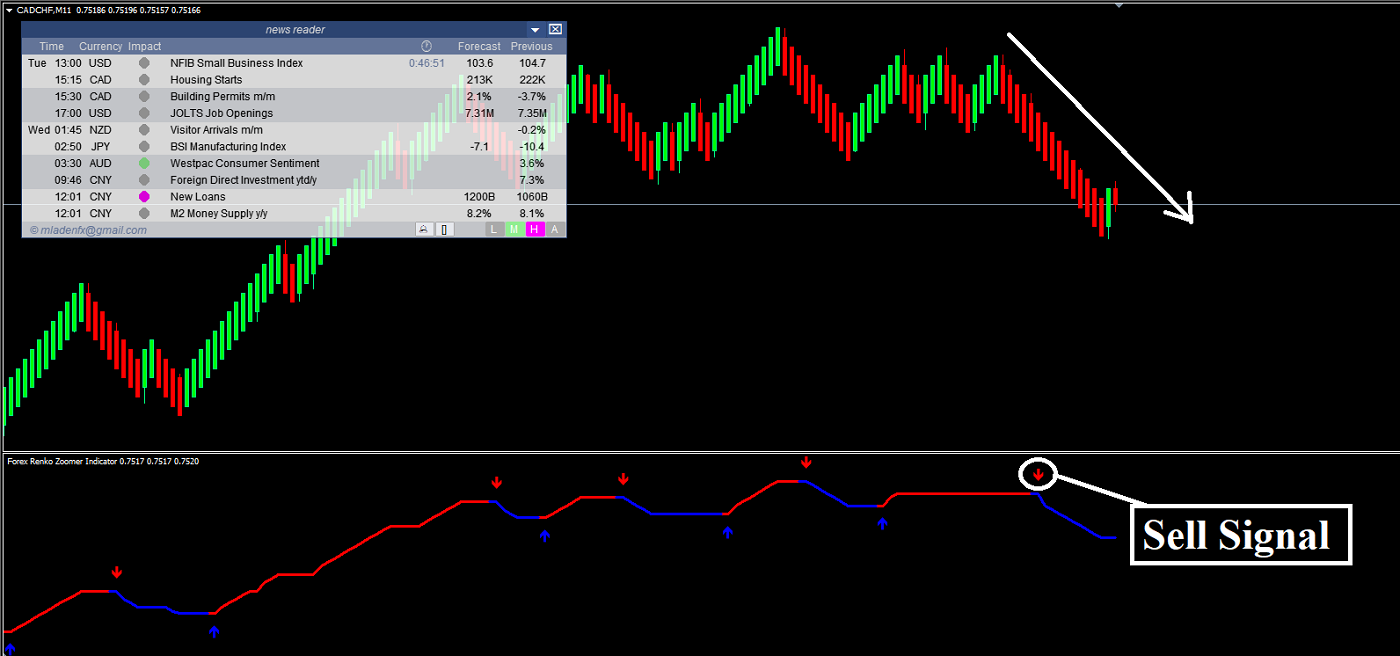
Renko Zoomer signals 100% NO PEPAINT indicators, optimized specifically for our offline charting setup.
A market calendar with many features so you can track major market events for optimal entry and exit points.
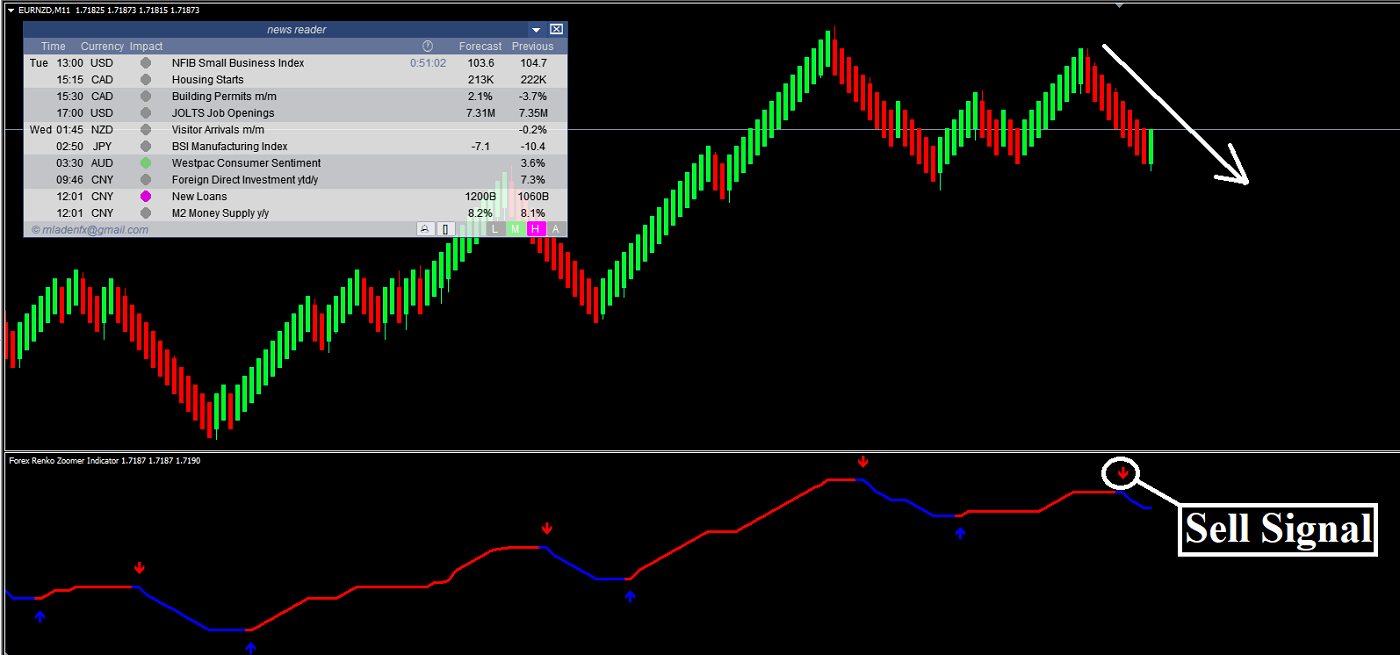
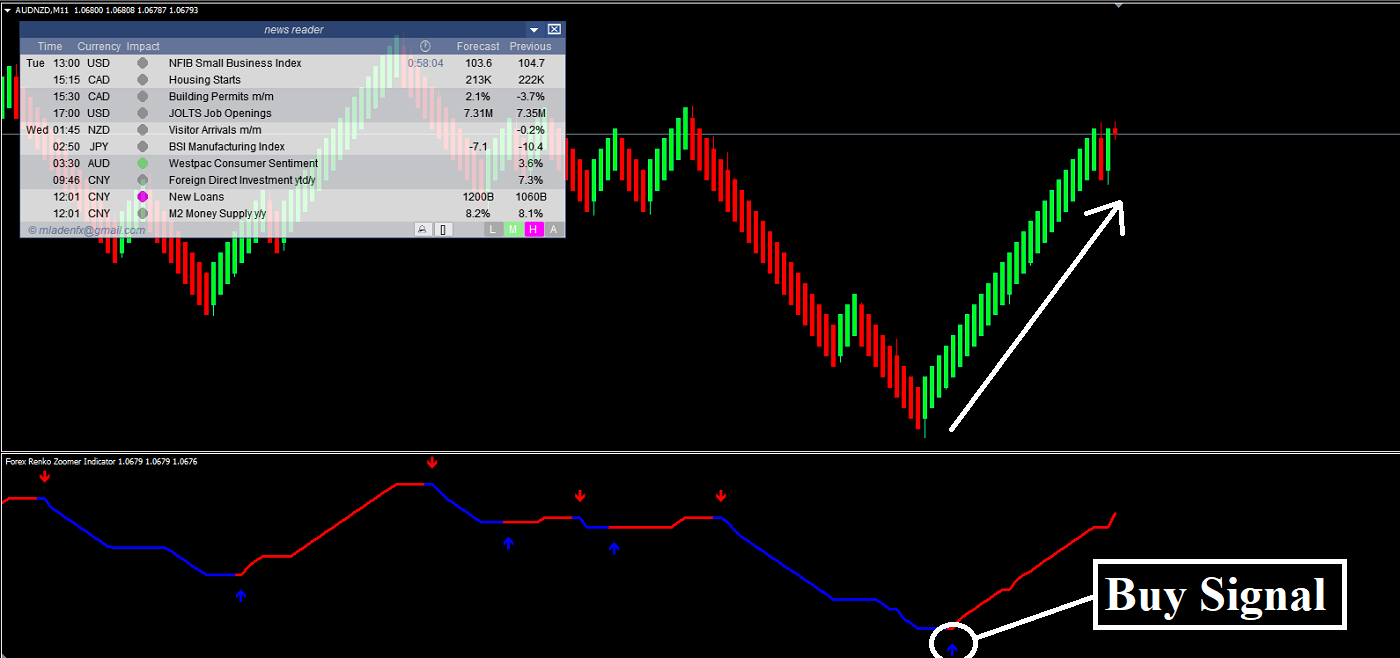
What the RENKO ZOOMER strategy can do for you
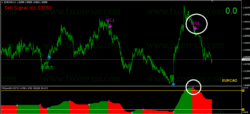
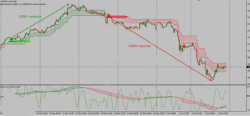
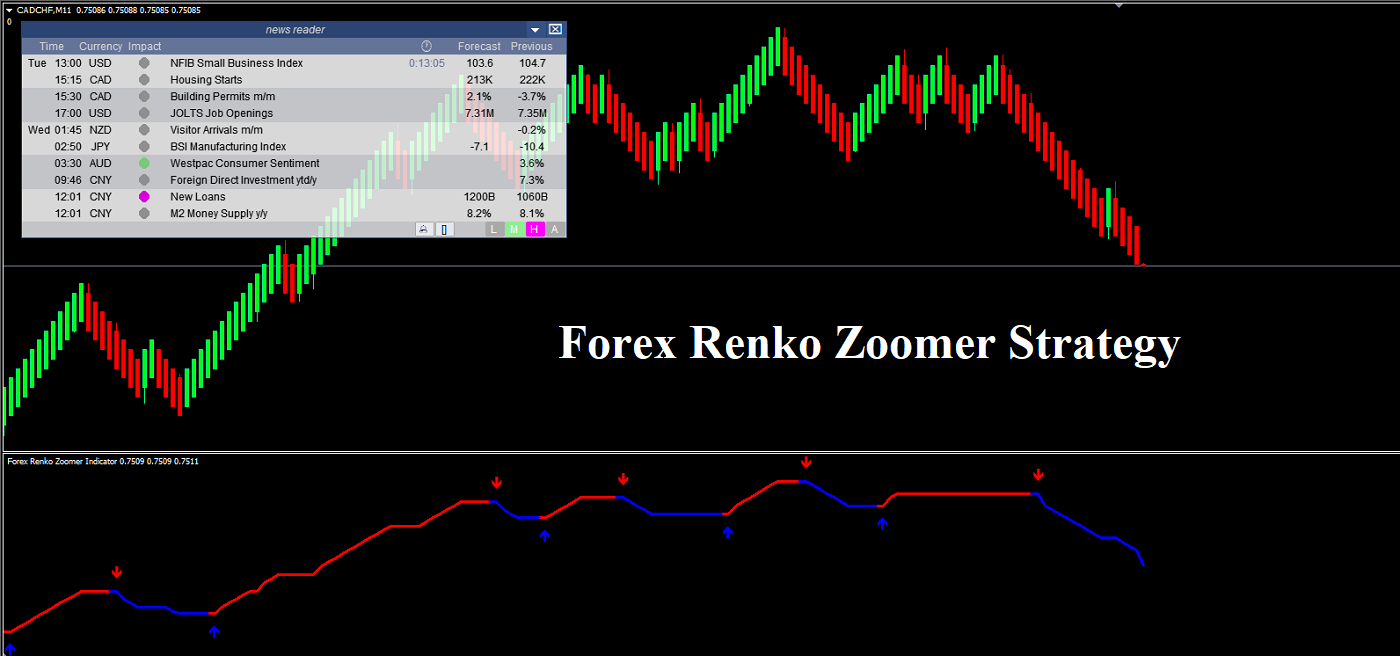
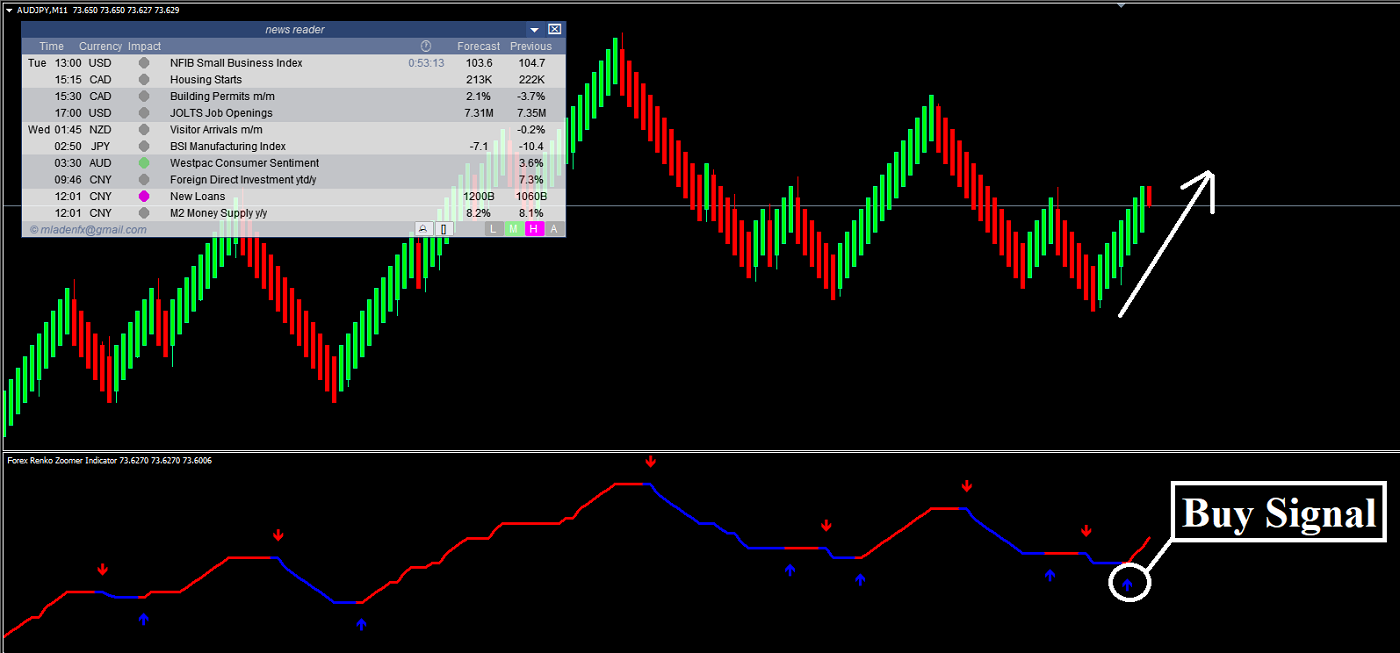
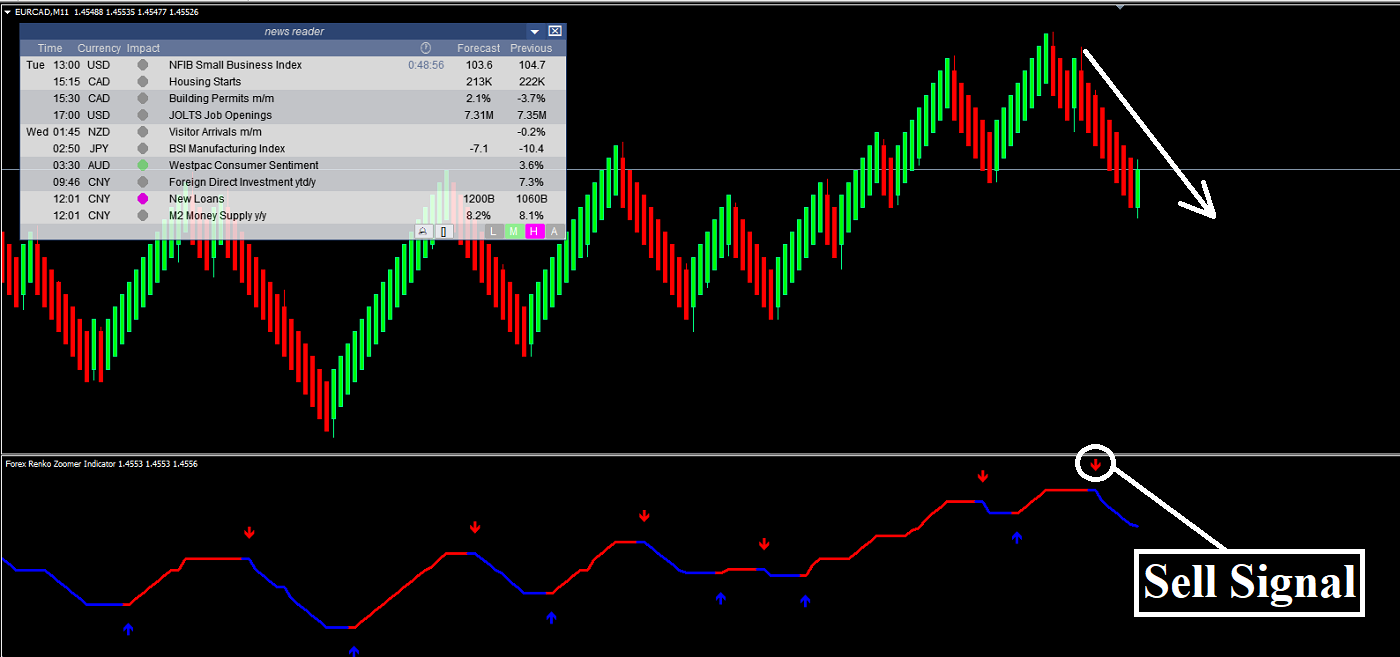
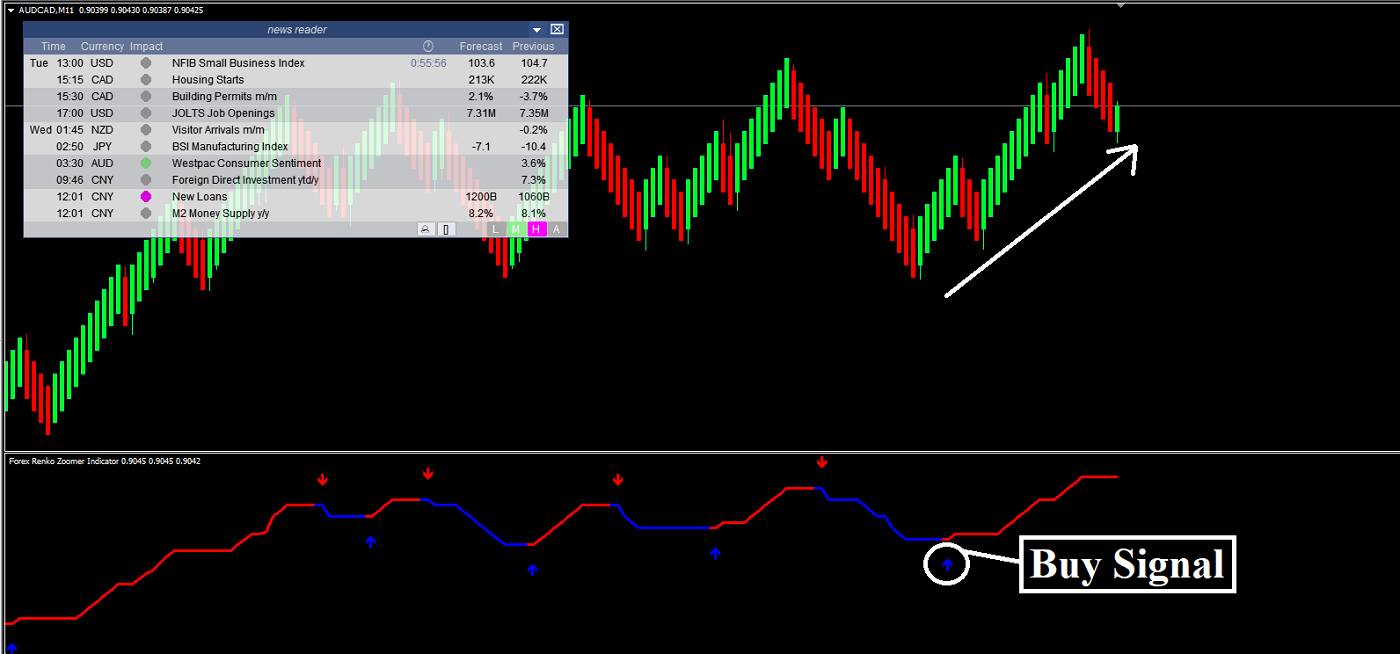
Let’s examine some chart examples below.
What are the benefits of using brick charts?
Brick diagrams may not be as popular as candlesticks, but they have their own unique advantages.
They are “cleaner” than others. In this case, clean does not refer to the visual appeal of the chart, but rather to the reduction of noise. Candlestick charts are particularly prone to noise because they have solids and shadows/wicks. These components make it more difficult to establish patterns in the market because they create noise that must be taken into account. Brick charts, on the other hand, consist of similar sized bricks in contact with each other and make it easier to see trends or pattern forms.
Price movements are more accurately defined in Renko charts. For planning purposes, it makes risk management easier because price targets are very specific.
Renko charts are also visually appealing. Due in part to their simplicity and the addition of color, the brick charts are not difficult to interpret.
The difference between price and time charts and price only charts
All bricks in a Renko chart are similar in size, while candles in a candlestick may have different sizes. In addition, candles can come with shadows/wicks, which further modifies the size of the candles.
In a candlestick chart, a new candle is formed at the end of each trading period, but a new brick is formed only when the price reaches the determined value in the Renko chart.
Technical analysts can determine market sentiment simply by looking at the candlesticks, but the brick charts do not show the sentiment in the market.
The Renko chart shows very clear support/resistance levels, which simplifies the process of identifying these areas.
Candlestick charts are the same for all traders in the same trading period, while brick charts allow traders to set their own price zones and get a personalized chart. this flexibility of Renko charts allows them to adapt to a trader’s strategy, not the other way around.