Description
Plot automatic supply and demand areas on your charts.
Supply and demand is a basic economic term that indicates the availability of sellers willing to sell and buyers willing to buy. That said, supply and demand are important factors in price movements. In fact, both supply and demand are regulators of price, while price regulates supply and demand.
Given that trading is all about price movements, the concept of supply and demand should be incorporated into forex trading.
The driving force behind price changes is supply and demand. When there are more buyers than sellers, the market price goes up. Conversely, when there are more sellers than buyers, the market price falls. When buyers and sellers are more or less equal, the market fluctuates. These simple concepts are very powerful and allow us to analyze naked charts to determine where prices are likely to go.
How do I trade with the automated MT4 Supply and Demand indicator?
Buy Setup – Entry, Exit and SL
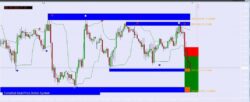
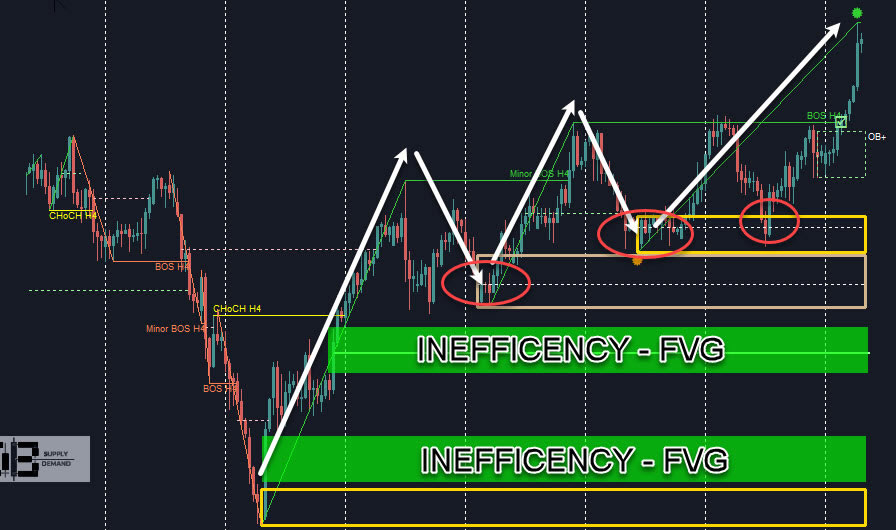
To simplify this strategy, we will use the Supply and Demand indicator, which can easily plot these possible supply and demand areas
Buy Entry: To enter the buy setup, we must observe the price when it touches the nearest new demand area. Our indicator plots this area as a blue rectangle. Once the price touches this area, the next candle should bounce off the blue rectangle. This in itself is a strong bullish sign.
Stop Loss: The stop loss should be a few pips below the blue rectangle.
TP1: The stop loss for the first half of the position should be the 50% line between the demand area (blue rectangle) and the nearest supply area (red rectangle).
TP2: The take profit for the remaining half of the position should be 80% of the line between the demand area (blue rectangle) and the nearest supply area (red rectangle).
Trailing Stop: Once the price reaches the first stop loss target, you should trail the stop loss to breakeven plus a few pips.
Sales Setup – Entry, Exit and SL
Sell Entry: To enter the Buy Setup, we must watch the price as it touches the nearest fresh supply area. The tool draws it as a red rectangle. Once the price touches that area, the next candle should bounce off the red rectangle. This indicates that the price may go down.
Stop Loss: The stop loss should be a few pips above the red rectangle.
TP1: The first half of the stop should be the 50% line between the supply area (red rectangle) and the nearest demand area (blue rectangle).
TP2: Take profit on the remaining half of the position should be 80% of the line between the supply area (red rectangle) and the nearest demand area (blue rectangle).
Trailing Stop – Once the price has reached the first take profit target, you should track the stop loss to break-even plus a few pips.