Sale!

Zain v6 mt4 (NO REPAINT SYSTEM)

$29.98

-
+

Specs

Categories: ,

Description

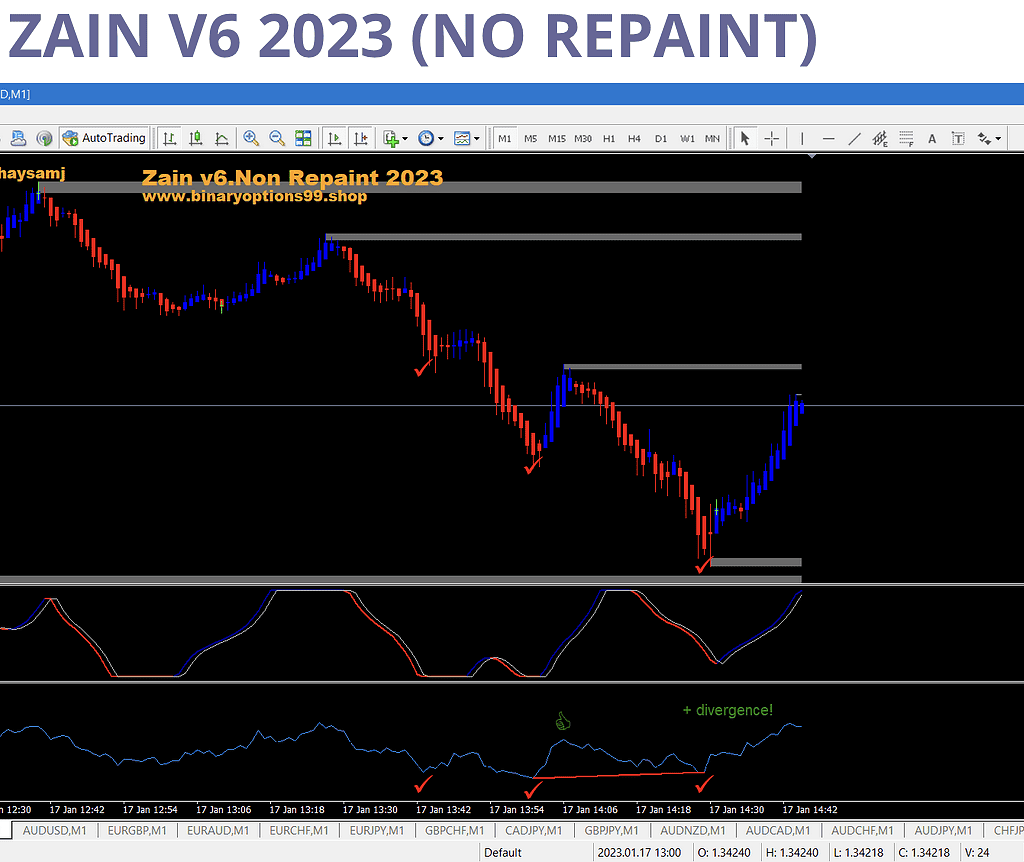
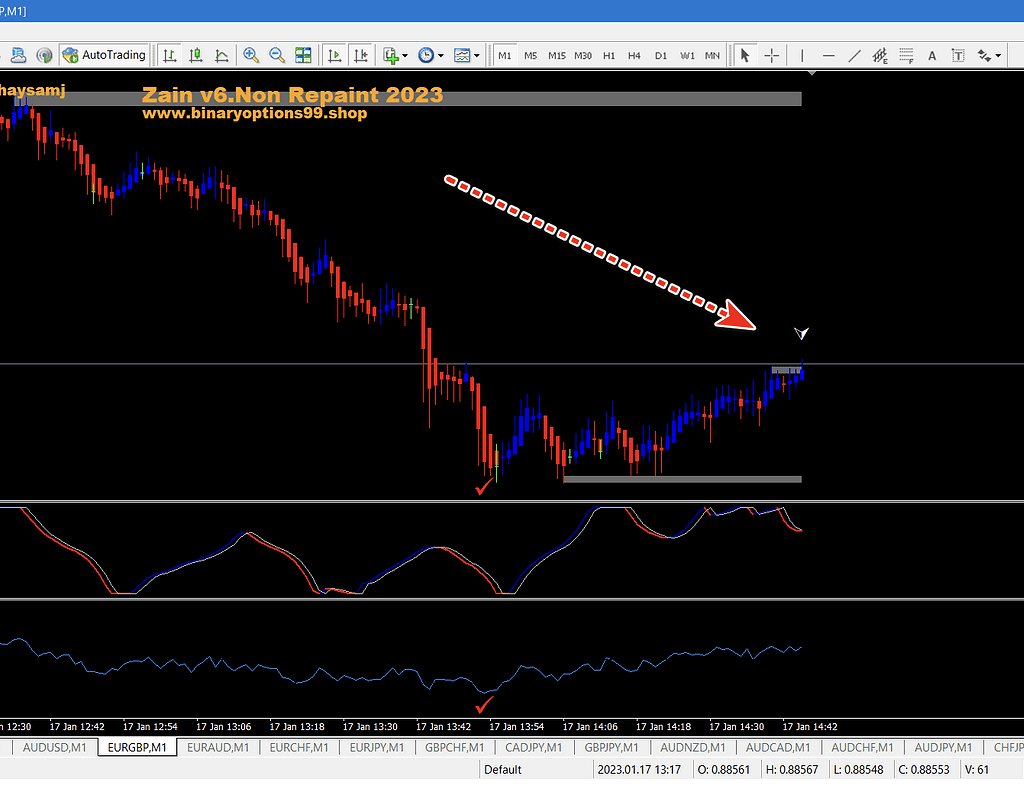
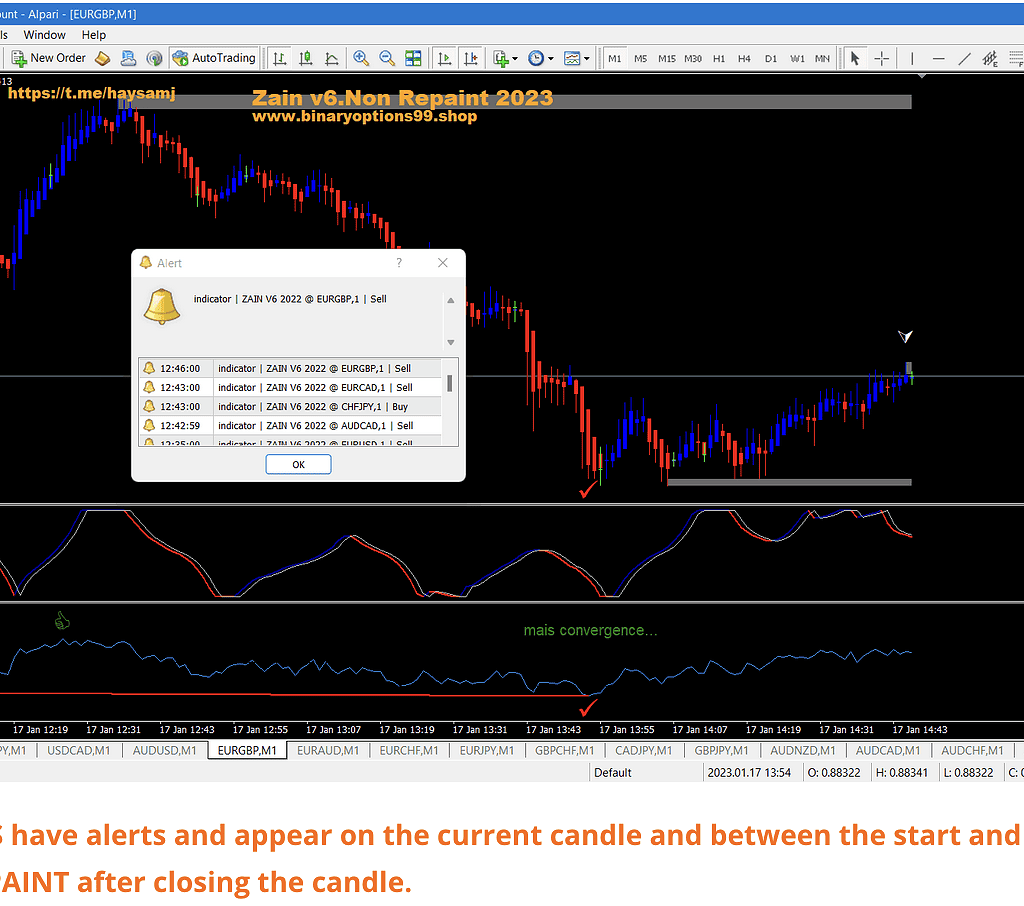
Content: Indicators: zain.ex4, zain v6 rc 2023.ex4, ZAIN V6 2022_fix.ex4, zain co v6 2023.ex4, stochastic-cg-oscillator.ex4, Heiken Ashi-.ex4, Template: ZAIN V6 2023.tpl, How to install MT4 files.pdf

Zain v6 mt4 (NO REPAINT SYSTEM) Zain v6 mt4 (NO REPAINT SYSTEM) Zain v6 mt4 (NO REPAINT SYSTEM)

The Zain v6 indicator is a technical analysis tool available for MetaTrader 4 platforms. It identifies support, resistance and volatility price levels based on algorithms developed by expert trader Zain Udeen. The indicator then plots projected future support and resistance lines on the chart.

Overview of the Zain v6 Indicator

The Zain v6 indicator scans historical price data and pinpoints significant support and resistance levels using a complex set of price pattern analysis algorithms.

It aggregates the data and calculates likely future support and resistance zones. Finally, it plots lines on the chart showing projected levels with a high probability of acting as future support and resistance.

Creation and History

The Zain v6 indicator was developed by full-time trader Zain Udeen based on decades of studying price action and testing statistical models on historical financial data.

The “v6” in the name refers to this being the 6th iteration of the indicator after extensive research, development and real-world usage optimization over many years.

Benefits of Using Zain v6

Zain v6 provides numerous potential benefits for traders:

  • Automated plotting of projected support/resistance
  • Price level alerts when reached or broken
  • Quantified entry, exit and stop loss points
  • Models adapt quickly to changing market conditions
  • Detailed documentation and instructional resources

Key Features and Functions

  • Multiple price pattern recognition algorithms
  • Current and historic support/resistance identification
  • Plots projected future support and resistance levels
  • Monitors price activity around projected zones
  • Triggers alerts when price reaches or breaches levels
  • Detailed indicator and level data window

How the Indicator Works

Zain v6 performs complex price pattern analysis in real-time to determine support and resistance:

Analyzes Price Action Using Multiple Algorithms

The software runs price data through a series of proprietary algorithms that recognize significant support and resistance levels based on recurring price patterns and market behavior.

Identifies Support, Resistance and Volatility Levels

It identifies historic levels that have acted as support and resistance multiple times, indicating significance. It also calculates price volatility ranges.

Plots Projected Support and Resistance Lines

Combining the pattern data, volatility, and weighting factors, the software plots projected support and resistance lines on the chart where future bounces are statistically likely.

Signals When Price Reaches or Breaks Levels

As price interacts with the projected levels, the indicator triggers visual, audio and alert options to signal traders.

Key Parameters and Settings

The main settings involve weighting factors given to different models, length of historical data used, number of projected lines, and days into the future to forecast.

Trading Strategies Using Zain v6

Zain v6 can be incorporated into trading strategies in several ways:

Entries from Bounces Off Support/Resistance Lines

When price pulls back to a projected line, traders can buy anticipating a bounce off support or sell a resistance touch expecting rejection. Stops placed beyond level.

Profit Taking at Projected Future Levels

During open trades, exiting partially or fully at upcoming projected levels allows proactive profit protection and risk management.

Trading Breakouts from Ranges

When price breaks support or resistance decisively, the projected strength of the level is invalidated indicating follow through potential.

Using for Stop Loss Placement

Projected levels provide clear areas to place stops, ensuring they align with market structure rather than arbitrary round numbers.

Optimizing Zain v6 For Your Trading

Modifying Zain v6 settings can optimize its performance:

Adjusting the Projection and Volatility Settings

Increasing projection duration and volatility expands projected levels. Shortening them adapts the indicator to smaller temporary ranges and faster markets.

Selecting Appropriate Trading Instruments

The algorithms work best on liquid markets with clearly defined support/resistance levels like S&P 500 rather than erratic penny stocks.

Choosing Timeframes to Match Trading Plan

Day traders may optimize the indicator for 5 min charts while swing traders focus on 4 hour or daily timeframes.

Backtesting to Validate Performance

Forward testing the indicator on historical data quantifies win rates and profitability to ensure it aligns with a trading method before risking capital.

Using With Other Indicators

Zain v6 can be combined with traditional technical indicators for robust signals:

Combining with Classic Indicators like RSI, MACD etc.

Overbought/oversold signals help confirm bounces. Divergences signal impending support/resistance breaks.

Incorporating other MT4 Custom Indicators

Sentiment, volatility and momentum indicators help gauge environment as price reaches projected levels.

Building a Robust Trading System

A system of multiple confirming indicators with clear entry rules, risk management and profit taking creates an edge.

Strengths and Limitations of Zain v6

Strengths

  • Clear plotted support and resistance levels
  • Signals at projection points
  • Automated vs. manual indicator trading

Limitations

  • Lagging nature of projections
  • No predictions, only reactive levels
  • Subject to false breaks like any indicator

Advanced Strategies and Tips

Trading Moving Average Crossovers at Projected Levels

Combining crossovers with projected support/resistance provides a high probability entry method.

Scaling Out Trades at Multiple Projection Points

Closing portions of a trade at incremental projected levels lets profits run while capping risk.

Using Zain v6 Projections for Stop-Loss Placement

Stops aligned to structure have greater chance of withstanding whipsaws versus random round numbers.

Focus on OB/OS Signals for Highest Probability

Projected levels coinciding with overbought/oversold indicators have higher chance of holding.

Managing Trades at New Day Open vs. Indicator Lines

A new trading day resets volatility cycles, so considering closing before new day opens rather than waiting for a projected level intraday.

Zain v6 On Other Trading Platforms

Availability in TradeStation, NinjaTrader, etc.

The indicator is primarily designed for MT4 but also available in TradeStation and NinjaTrader for traders using those platforms.

Comparing MT4 Version Performance to Other Platforms

The underlying logic remains the same across platforms but GUI appearance, alert sounds and some functionality may differ slightly.

Broker Availability and Symbol Support Outside MT4

Since Zain v6 analyzes price action rather than using fixed formulas, it supports most liquid instruments across various brokers. But optimal results are instrument dependent.

Conclusion and Final Thoughts

In summary, the Zain v6 indicator provides automated identification of projected support and resistance levels for traders to incorporate into their strategies. The tool reflects years of price pattern research and development into a robust indicator.

However, it still requires prudent interpretation and implementation based on broader technical and fundamental analysis. As with any indicator, traders must validate it fits their trading style through practice and backtesting before applying it in live markets with real capital. Within a structured, risk-managed trading plan, Zain v6 offers significant potential value to MT4 traders.

Reviews

There are no reviews yet.

Be the first to review “Zain v6 mt4 (NO REPAINT SYSTEM)”

Your email address will not be published.