Renko Maker Pro Trading System

We really found that The Renko Strategy was very valuable. If you are looking for something powerful that isn’t overly complex, whether you are a beginner or an expert, then the Renko Forex Trading Strategy is just the thing. Not only are its results assured, but the manner in which it executes makes it a clear front-runner in terms of being simple yet effective. Now the Renko forex trading is a highly profitable 100% mechanical system that seeks to put you on the right side of the market most times. Renko charts are used to determine the following (a) Easy identification of support and resistance lines. (b) Easy identification of continuation patterns such as triangles. (c) Identification of reversal patterns such as head and shoulders, triple tops, double bottoms, and other classically accepted reversal patterns. (d) Discovery of trends and their reversals that cannot be “seen” on a PPS chart. (e) Refine our abilities to trade/swing a chart as to build up our accounts.
Simple, Easy, and Clean System without complicated rules.
System value is 59$ limited copies now only 19.99$
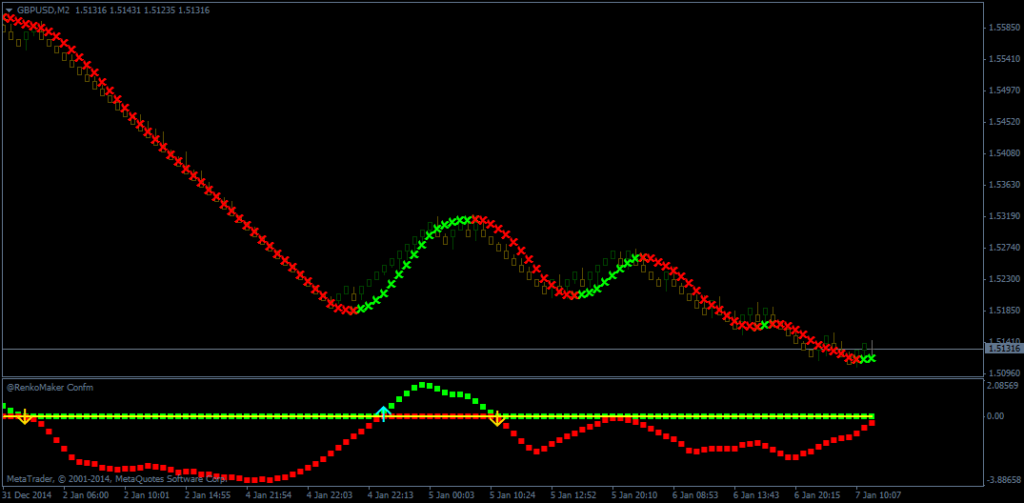
Double Confirmation
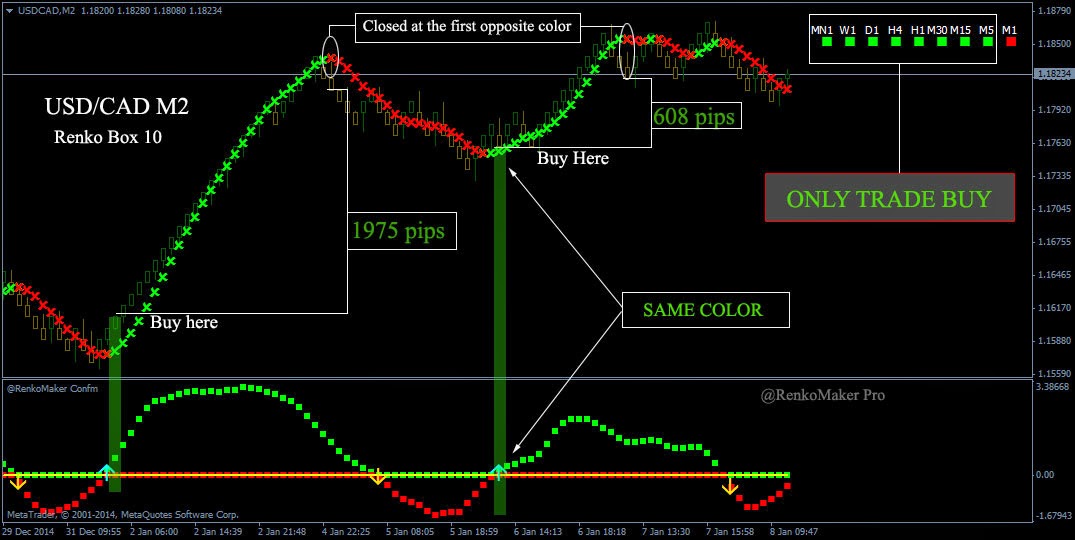
– Renko Maker Confirm – you can avoid the false signal. Only trade with a valid signal confirmed by this Indicator.

System value is 59$ limited copies now only 19.99$
The Renko Maker Pro trading system is a technical analysis approach for identifying trend direction and momentum using Renko charts. It utilizes the proprietary indicators developed by the Trading Institute to trade the financial markets.
Renko charts display price action in uniform “bricks” rather than candles. Bricks are plotted when the price closes a defined tick size above or below the prior brick. This filters out noise and focuses on underlying price momentum.
The Renko Maker Pro system combines Renko charts with several indicators to time entries and exits. Used correctly, it allows traders to profit from sustained trends in various markets.
How the Renko Maker Pro System Works
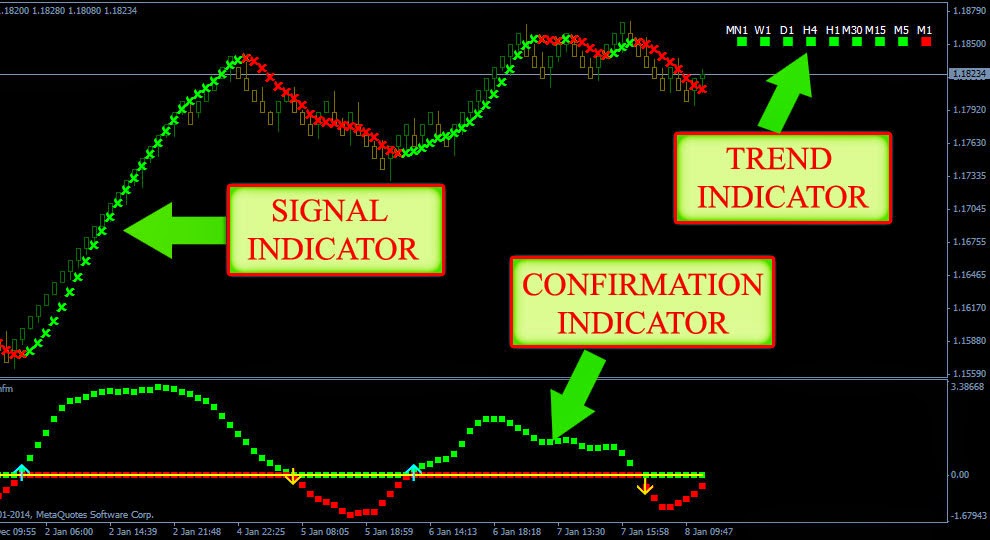
The core components of the Renko Maker Pro system are:
- Renko Charts – Filters price action into Renko bricks to identify trends
- Momentum Oscillator – Gauges whether momentum is gaining or losing steam
- Parabolic SAR – Signals potential reversals when the trend exhausts
- Moving Averages – Define dynamic support and resistance
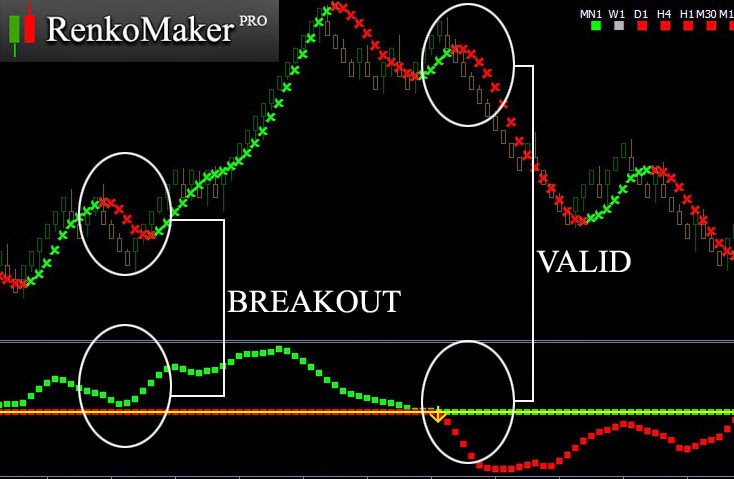
Entry Rules:
- Go long when 2 green Renko bricks form after the oscillator trough and the SAR dot flips below the price
- Go short when 2 red Renko bricks form after the oscillator peak and the SAR dot flips above the price
Exit Rules:
- Close long position when oscillator declines from the peak and SAR dot appears above the price
- Close short position when oscillator rises from the trough and SAR dot appears below the price
Trading with Renko Charts
Renko charts are the foundation of this system. Here are some tips for trading with Renko bricks:
- Bricks represent closing prices, not highs/lows
- No time element – New bricks form based on tick size movement
- Larger brick size for trends, smaller for trading ranges
- Gaps between bricks signify accelerating momentum
- Closing above/below the prior brick signals a new trend bar
- Count brick sequences to define trade duration in trend
- Draw trendlines linking brick highs/lows as support/resistance
How to Use the Momentum Oscillator
The momentum oscillator in this system helps identify opportune trade entry and exit points relative to trend strength.
Entry Confirmation: Wait for the oscillator trough and upturn to go long. Look for oscillator peak and downturn to go short.
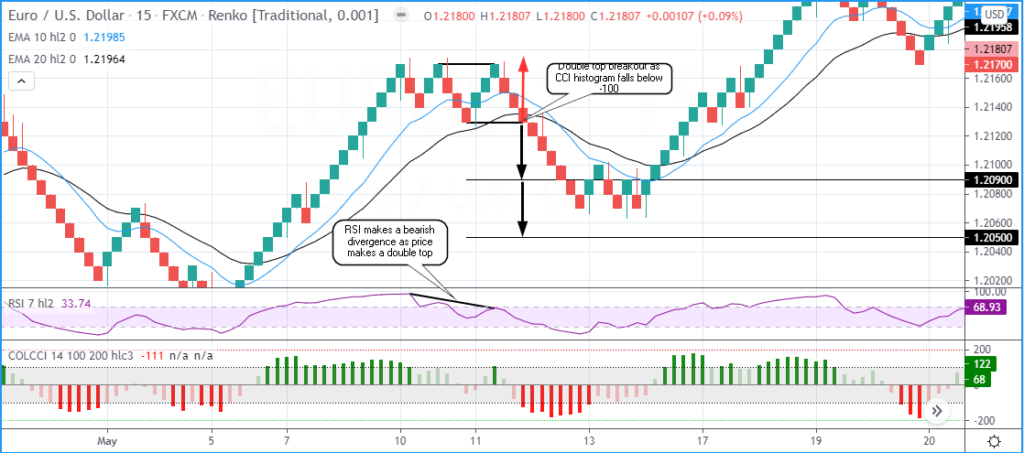
Exit Signal: Closing momentum divergence by oscillator highs/lows falling while price makes higher highs/lower lows hints at impending trend exhaustion.
Trend Strength: Increasing oscillator peaks in uptrends and troughs in downtrends show accelerating momentum. Declining highs/lows indicate waning momentum.
Divergences: Spot bullish/bearish divergence between oscillator and price to anticipate potential trend reversals.
Trading Signals from Parabolic SAR
The parabolic SAR indicator generates trading signals when placed on Renko charts.
- SAR dots flipping from below to above price indicates uptrend exhaustion
- SAR dots flipping from above to below price signals downtrend exhaustion
- Long trades when SAR dot drops below Renko bricks
- Short trades when SAR dot rises above bricks
- Exit longs when SAR dots start appearing above the price
- Exit shorts when SAR dots emerge below the price
How to Use Moving Averages
Moving averages act as dynamic support and resistance levels in this system.
- 20 & 50 SMA indicate short-term support/resistance
- 100 & 200 SMAs provide long-term support/resistance
- Price bouncing off moving averages signals a high probability of long entries
- Price breaking moving average decisively suggests closing trades
- Trend changes when faster SMA crosses over slower SMA
Optimizing the Trading System
Follow these tips to improve the performance of the Renko Maker Pro system:
- Use on higher timeframes (4H, daily, weekly) for reliable signals
- Experiment with Renko brick size based on market volatility
- Customize oscillator (RSI/stochastics) settings for smoothing
- Adjust moving averages to market conditions
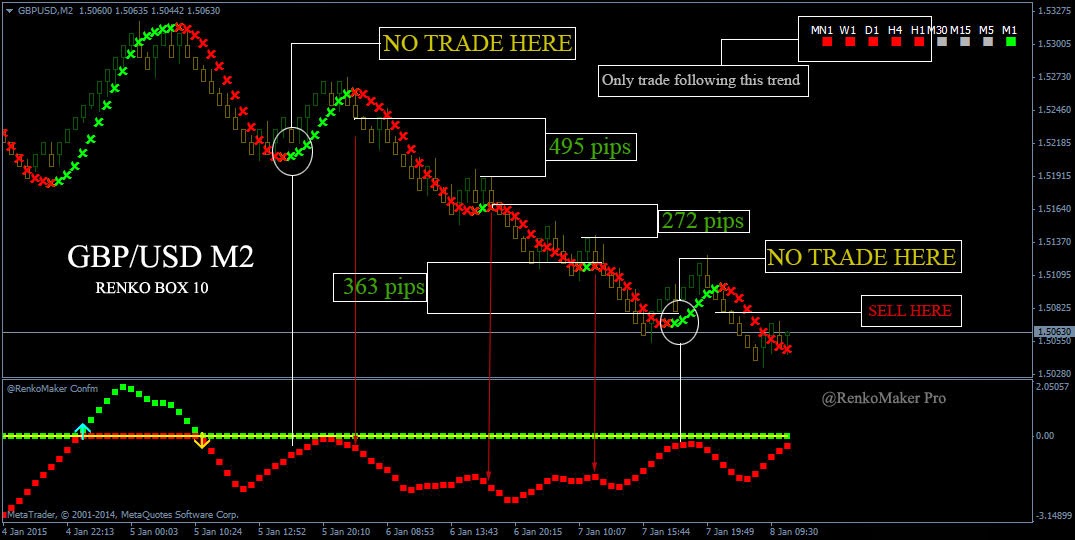
- Only trade in the direction of the higher timeframe trend
- Confirm signals across multiple timeframes
- Combine with candlestick patterns for high-probability setups
Money Management and Risk Control
Effective money management is critical when trading this system.
- Determine appropriate position sizing based on account size and risk tolerance
- Place stop loss orders below key swing lows in uptrends, above swing highs in downtrends
- Move stops to break even once trade gains sufficient profit
- Trail stops to lock in profits as trend progresses
- Stick to trading edge with strict discipline
- Limit trades to the highest probability setups
- Re-assess system performance monthly and refine as required
The Benefits of Trading Renko Charts
Some key advantages of incorporating Renko charts:
- Filters out market noise to focus on price momentum
- Bricks simplify trend analysis and identification
- Charts remain uncluttered due to the absence of wicks
- Gaps between bricks emphasize accelerating momentum
- Bricks close only in one direction in trend making reversals obvious
- Winning trades can be held longer as bricks extend
- Clear risk management since bricks act as support/resistance
Conclusion
The Renko Maker Pro trading system offers a structured approach to trading trends across various markets using Renko charts. By combining Renko bricks with confirming indicators, defining risk management protocols, and optimizing system parameters, traders can boost performance and sustain consistent profits. However, as with any system, strict money management, discipline, and patience remain key.
FAQs
Q: What markets can be traded using this system?
A: It can be applied to trending markets like forex, stocks, commodities, and cryptocurrencies.
Q: Does this system require monitoring charts constantly?
A: No. Once entry rules are met, periodic check-ins suffice. The SAR dot and momentum oscillator will signal exits.
Q: Can beginner traders use this system profitably?
A: Yes, though sufficient practice on the demo is required to master entries, exits, and discipline. Study tutorials before trading live.
Q: What timeframes does this system work best on?
A: Daily and 4-hour timeframes ensure reliable signals. Intraday timeframes tend to be noisy.
Q: How to adapt the system for market volatility?
A: Use larger brick size and slower moving averages for volatile markets, smaller brick size, and faster MAs for calmer conditions.

Responses