Auto Support and Resistance Zones Indicator

Interestingly, by default, there are no indicators in the MT4 terminal that can be used to automatically create resistance and support levels. These levels are one of the most important aspects of technical analysis that many traders rely on. It is the automatic support and resistance indicators that solve this problem.
Indicator Description
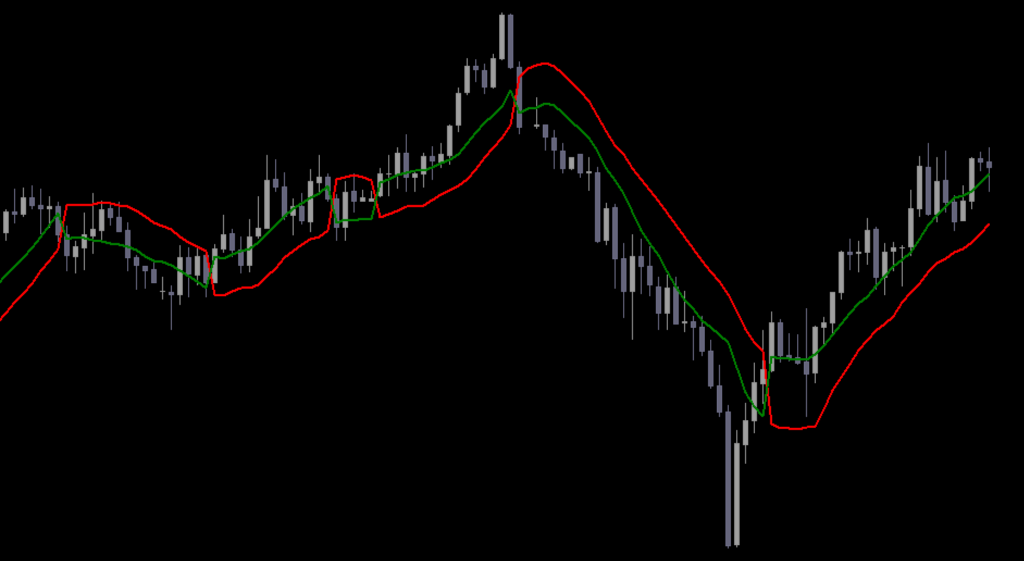
Its support and resistance indicators automatically plot significant resistance and support levels on the chart.
Resistance levels (zones) are shown in red on the chart. Support zones (areas) are highlighted in blue. Support levels are a signal for potential buyers to watch as price approaches the support level.
Resistance levels show the opposite, if the price is close to the level, there may be buyers’ attention.
The indicator automatically plots resistance and support levels, allowing you to reduce your time and effort when analyzing charts. This is certainly an advantage for experts and beginners.
For those who are new to Forex, it is recommended to draw horizontal lines with a pencil. This will help increase knowledge and understanding of the pricing process on the Forex market. If you use manual drawing of resistance and support levels, the automatically drawn levels can be considered as an example and a help.
The support and resistance levels shown by the indicator can be used as an aid in placing order closures (stop-loss and take-profit). In addition, they can help identify the signals needed to open a position.
Indicator Drawing Techniques
Support and resistance levels are generally plotted using market extremes, which are also known as fractals. In the set of commonly used indicators in MT4 terminal there is an indicator called Fractal indicator. It shows extreme values.
This support and resistance indicator already contains an indicator called Fractal Indicator. It shows the support and resistance levels in the areas where the most fractals occur.
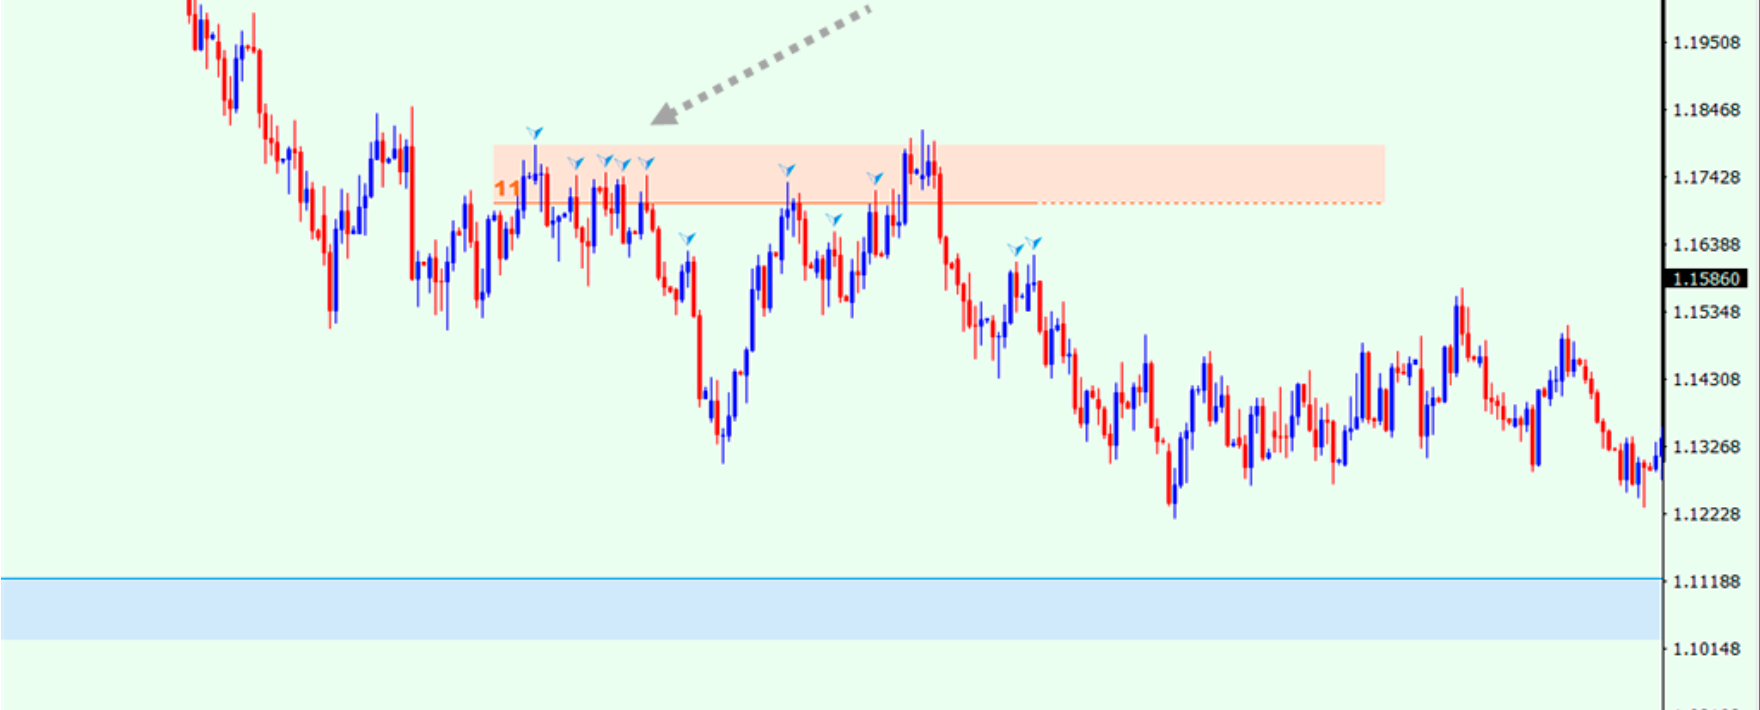
In this example, this resistance level is constructed based on 11 fractals. You can determine which fractal it uses by clicking on the number at the top of that level.
The number of resistance and support levels is determined by the distance of the fractal from one fractal and the distance of each fractal.
The greater the distance between the lower and upper levels of the fractal of the support/resistance level, the greater the slope of the plotted level.
And vice versa, the closer the distance between the upper and lower levels of the fractal, the smaller the height of the level.
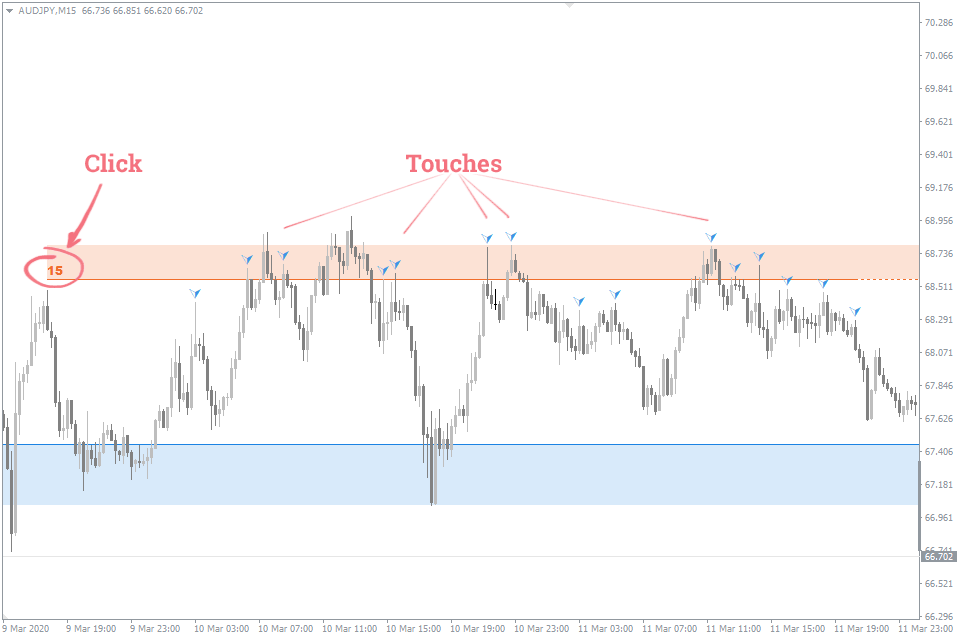
As you can see, some of the interactions are out of the filled rectangle, but this is not the indicator’s error. These touches are used to identify levels more precisely.
Support and resistance levels themselves occupy just under 50% of the area analyzed by the algorithm.
For whom is the Support&Resistance indicator suitable?
Support and resistance are important price reference levels that help traders in making Forex trades. Therefore, the S&R indicator is well compatible with any other indicator or trading system.
If you’re a novice trader, it’s important for you to learn how to draw support and resistance levels by yourself. However, the S&R indicator can be a good help if you don’t have enough skills yet.
The indicator will be useful for experienced traders as well, as it saves time on drawing the levels.
Trading With the Support&Resistance Indicator
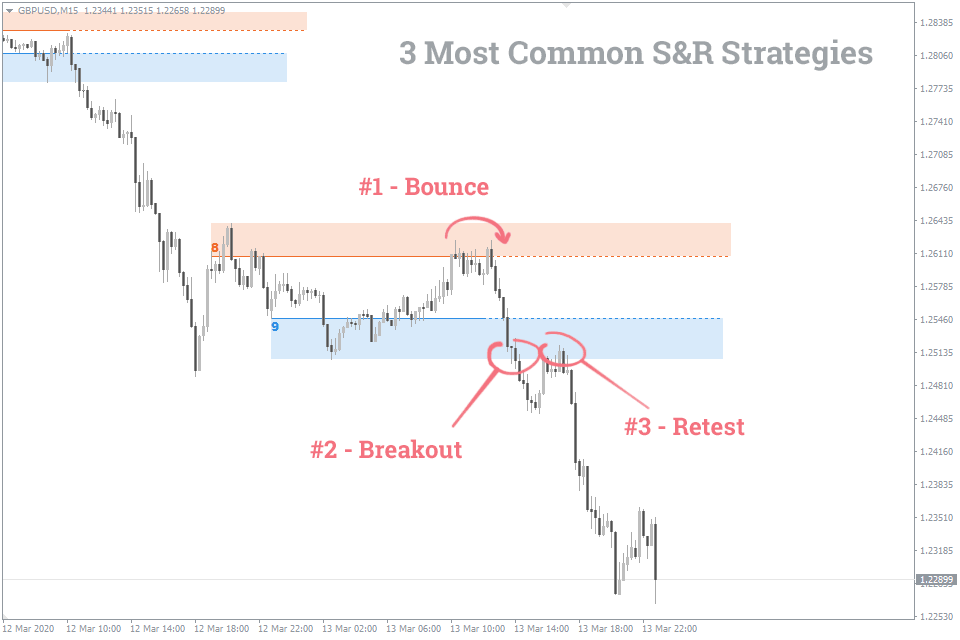
There are three major techniques of trading with strong support and resistance levels:
- Rebound (Bounce) from a level,
- Level breakout,
- Retest of the broken level.
Their benefit is that they are quite simple, so even a novice trader can easily use them.
[sociallocker id=24390]SupportResistance.zip[/sociallocker]

Responses