Bollinger Bands spike scalping
Bollinger Bands spike scalping
Spike Scalping Forex System
Open a 1 minute and place on the chart the standard default setting for
the Bollinger Bands.
When the price extends outside the bands by more than 8/10 pips place a trade to go long (when the price is outside the lower Bollinger Band) or a trade to go short (when the price is outside the
upper Bollinger Bands).
The distance the price has to be outside the bands is 8/10 pips from the
previous Bollinger Band close. Set a stop loss of 10 pips and a profit target of 10/15 pips. You can also take the 2nd entry 5 pips further from the stop loss level, i.e. if you
take a position 1.4000 to go long in EUR/USD and put your stop loss at 1.3990, then you may take your next position to go long, at 1.3985; if you get stopped out on 2 consecutive
positions in a given time period, then stand aside as this may be an indication of a strong market trend in the opposite direction.
Long Trades
The price should be outside the lower.
When the price has extended by 7/10 pips below lower
band
and 5 forex minute chart is also showing the price outside the
lower Bollinger Band,
go long.
Place stop-loss order 10 pips below the entry
point.
When in the trade as soon as you are showing 10/15 pips
profit exit the trade.
A second entry can be taken if the price moves 15 pips
below your first entry, stopping you out. If this second
position is stopped out do not trade this again, wait for
another opportunity.
Short Trades
The price should be outside the upper band.
When the price has extended by 7/10 pips above upper band
and 5 minute chart is also showing the price outside the lower Bollinger
Band,
go short.
Place stop-loss order 10 pips below the entry point.
When in the trade as soon as you are showing 10/15 pips
profit exit the trade.
A second entry can be taken if the price moves 15 pips
below your first entry, stopping you out. If this second
position is stopped out do not trade this again, wait for
another opportunity.
Examples
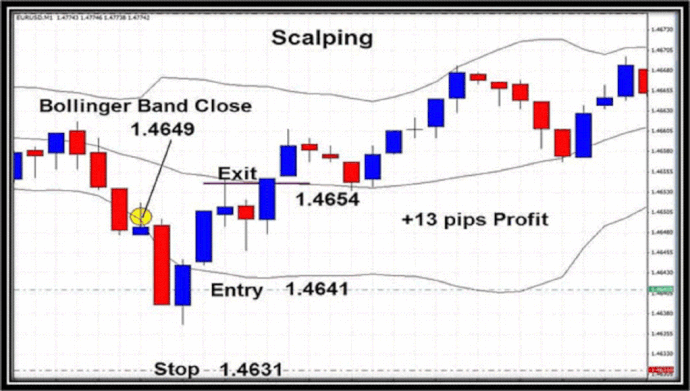
The screenshot below shows a scalping trade on the 1 minute
chart. The closing figure of the lower Bollinger
Band on the
previous candle is 1.4649 and the price went down to 1.4639
on
the next candle 8/10 pips below the Bollinger
Band figure,
triggering an entry setup.

After confirmation from the 5 minute trading chart that the price
was
also below the lower Bollinger
bands, an entry was made at
1.4641 with the 2 pip spread and a stop was placed 10 pips
below the entry. Profit was taken at 1.4654 for +13 pips.
The next example of a long trade captures 11 pips profit.
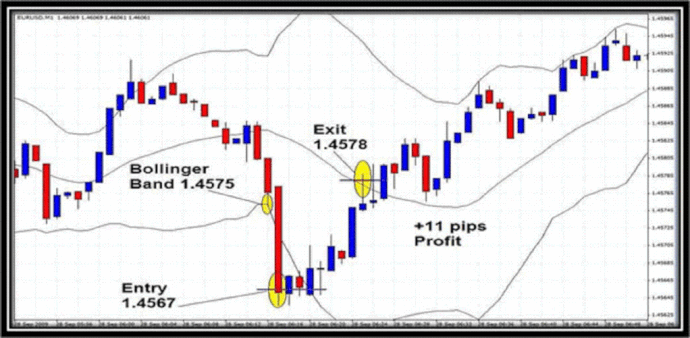
When the priced moved outside the lower Bollinger Bands we
had a look at the previous candle and the
closing Bollinger Bands
figure (1.4575). This meant if the price went as low as 1.4565
or
lower we would enter a trade to go long, if there was
confirmation on the 5 minute chart. A trade was taken at
1.4565
with a 2 pip spread giving us an entry price of 1.4567 with a
10
pip stop at 1.4557.
The trade was closed out at 1.4578 for 11 pips profit.
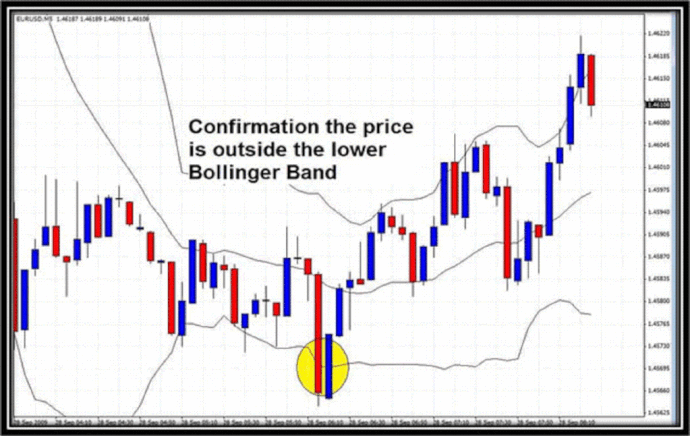
Confirmation to take the trade on the 5
minute chart (below).
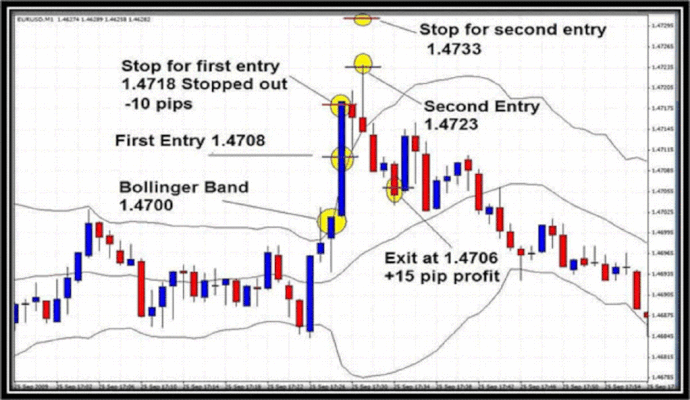
In this example the entry was confirmed to go short at 1.4708 on the
5
minute chart below, 8 pips above the close of the Bollinger Bands
trading
from the previous candle at (1.4700), a stop was placed 10
pips
away. Unfortunately, this first trade was stopped out at -10
pips
and the price carried on upwards. After it had moved 5 pips
above our first trade`s stop, a second trade was placed to
go
short at 1.4723 with a stop 10 pips above 1.4733. This trade
was successful with a +15 pip profit wiping out the loss on
the
first trade and coming away with +5 pips. This Forex system is very
good.
Share your opinion, can help everyone to understand the forex strategy.
- Platform: Metatrader4
- Currency pairs: Any pairs, indices and metals
- Trading Time: Around the clock
- Recommended broker: icmarkets, XM
- How to install MT4 indicator?
- 1. On the desktop, double-click to open the MT4 trading platform software you installed.
- 2. Click on “File” – “Open Data Folder” in the upper left corner, double-click the MQL4 folder, and double-click the Indicators folder
- 3. Copy the metrics you need to install to the Indicators folder
- 4. Open MT4, find “Navigator” in the display menu, then click “Technical Indicators” of “Navigator” and right click to refresh, you will see the indicator just copied.
- 5. In the “Technical Indicators” of “Navigator”, find the indicator file just installed, double click or click manually to the chart window

Responses