Forex Rads Reverse Trading System
Forex Rads Reverse Trading System
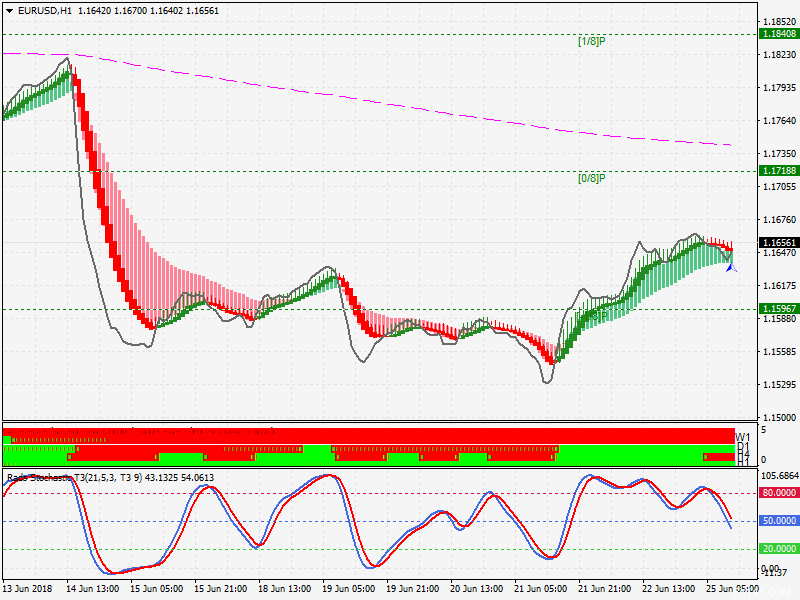
The indicators on the chart are:
Blue Line – my main indicator. It is a 27 period T3 moving average. I can’t explain exactly how a T3 differs but it is much smoother that a regular moving average. As a fan of W. D. Gann, I like his use of the number 9 in his various strategies and I incorporate it wherever possible. Thus the 27 (9 X 3).
Orange Line – 27 T3 on next higher time frame.
Red Line – 27 T3 on next higher time frame.
Purple Line – 27 T3 on next higher time frame.
Maroon Line – 729 EMA. This again is a multiple of 9 (9 X 9). Comparable to the 800 that some others like to use. I find it to be a sort of equilibrium point. Price invariably tends to return to that level. When you see price stalling, check the various time frames and usually you will find that it is the 729EMA on one of them.
Grey line – 2 period smoothed EMA. Represents price action.
HAS and HAS Extension – This gives the main visual indication of the move. I added the extension to help identify false breaks.
Center Window – MTF HAS Bars. These bars show the HAS indicator on the current and next 3 higher time frames.
Bottom Window – T3 Stochastic. Again, somewhat smoother than a regular stochastic. Set to 21-5-3 seems to line up very well with the other indicators.
This is a trend following system and so we look to enter and trade with the current trend on whatever time frame we are looking at. We want to identify reversal points and enter as close to the beginning of a trend as possible and add to our positions when possible.
Reversals are identified by a cross of the T3 accompanied by a color change on the HAS and a matching cross on the stochastics. In order to filter out false trades, look at the Center Window and wait for the first matching color change on the next higher time frame for the entry. When you see all trend lines converge, wait for the breakout indication to take the trade. You will often see all four bars in the center window change color at the same time just as stochastic crosses and a T3 line is crossed. That is a great entry point.
During the move watch for small corrections indicated by a change in color on the HAS but not the extension and on the current MTF Bar. Watch for stochastic to peak and cross back in the original trend direction and for the MTF Bar to resume its original color. This is often a good point to add to your position.
Exits are up to you. I use a combination of Murray Math lines and fib retracements to look for price to stall. Failure to penetrate a higher time frame T3 line or the 729 can also be a good signal to take your profits.
The template is setup to show the correct lines on every time frame so if you are on the 5 min, you will see the 5, 15, 30, and 60 T3 lines. If you are on the 30 min you will see the 30 min, the 60min, the 4hr and the daily T3, and so forth.
The trade system is the same on every time frame but obviously you need to adjust your trade size and stops accordingly. It also works on every pair I have looked.
Download Free Forex Rads Reverse Trading System
[sociallocker][url href=https://www.fx141.com/wp-content/uploads/2018/06/Forex-Rads-Reverse-Trading-System.zip]download[/url][/sociallocker]

Responses