

Description
The market structure reverse alert indicator will let you know when a price or trend is about to exhaust itself and be ready to reverse. This indicator alerts you when there are changes in the market structure, which usually occur just before a major pullback or reversal.
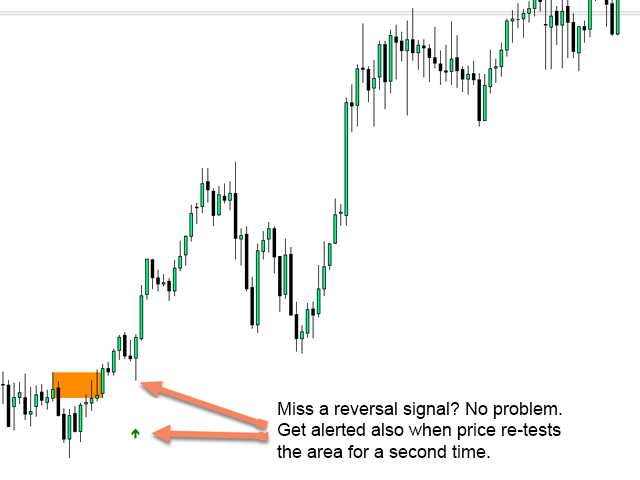
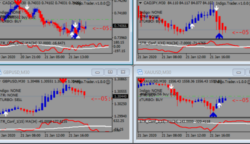
This indicator first identifies price momentum and breakouts whenever a new low or high is formed near an exhaustion point. The indicator draws a rectangle onto the last candle of the opposite color. The rectangle will be trailed along with the price as it moves in its current short-term trend. When the price falls below or above the rectangle, it indicates a possible shift in market structure. The indicator alerts you to a potential change in direction and the beginning of a possible trend reversal or major pullback.
Features
- Alerts you to potential changes in the market structure at key points of exhaustion.
- As the price approaches its exhaustion level, it automatically draws in the short-term market structure.
- Follow the alert rectangles as the price moves in the direction of its current trend to find the tightest entry.
- Alerts are changed to solid rectangles in solid color to indicate where there may be a reversal of market structure.
- All symbols and timeframes are supported.
- Built-in pop-up, email, and push alerts
- Alerts are sent when the re-testing of an alert confirms that it is more likely to be true.
- You can view reversal rectangles from higher time frames on a lower timeframe. Ideal for trend traders who want to identify a higher timeframe trend direction.
- You can choose to receive all reversals or only long or short alerts. Select the direction of the alerts based on the current trend direction for each pair.
- Look for the arrow indicating a higher timeframe on your lower chart.
Trading with Market Structure Reversal Indices: Strategy and How to Trade Them
When a reverse alert occurs:
- Look to the left! Look left! When the price is retesting a previous level or when a stop-hunt has just occurred above this support or resistance level, market structure shifts occur.
- Consult the higher timeframe to determine if we are focusing on an area of resistance or support. Changes in the market structure can often be seen on lower timeframes when they are at higher levels.
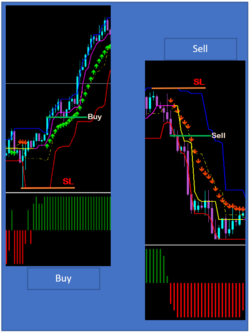
If you meet the conditions above, simply trade in the opposite direction.
This indicator can be used to validate your strategy or existing indicators.
Take Profit and Stop Loss
Stops should be placed just above or below the recent high. The price will only move above or below recent highs if the reversal correctly identifies a change in the market structure. Your stop size will depend on how aggressive your last move was to create the most recent high.
The individual decides how much profit to take, but a risk-reward ratio of 1.5:1 or 2:1 is easy to achieve. If you enter 2 trades, and one of them trails along the price that is just above or below new rectangles on the chart as they appear, then it’s possible to achieve a risk-reward ratio up to 5:1.