 options trading system
  ATRH INDICATOR Download
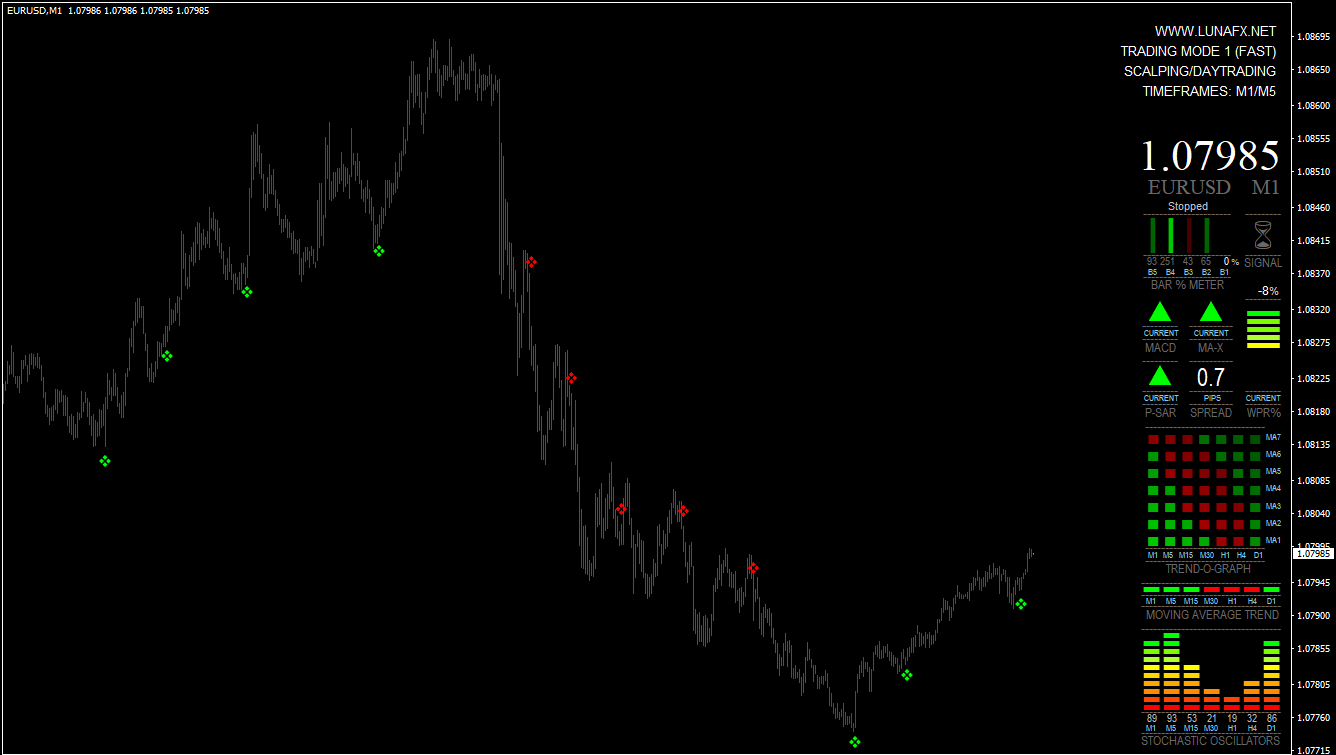


Description
Non-repaint buy/sell signals indicator is a complete MT4 trading software. It gives non-colored buy/sell signals. It is easy to use for both novice and advanced traders. The software helps users to make informed decisions when trading in the Forex market. It also comes with an on-screen dashboard that displays other useful information.
MT4 Trading Indicator is a combination of cutting-edge technology and simplicity. The software provides accurate analysis and trading signals to assist users in making informed decisions in the forex market. Intelligent trend analysis calculations identify trending markets, allowing users to trade on par with larger traders. non-repaint buy/sell signals indicator also allows users to know when it is time to stop trading. This helps them avoid flat markets and keeps them ahead of the game.
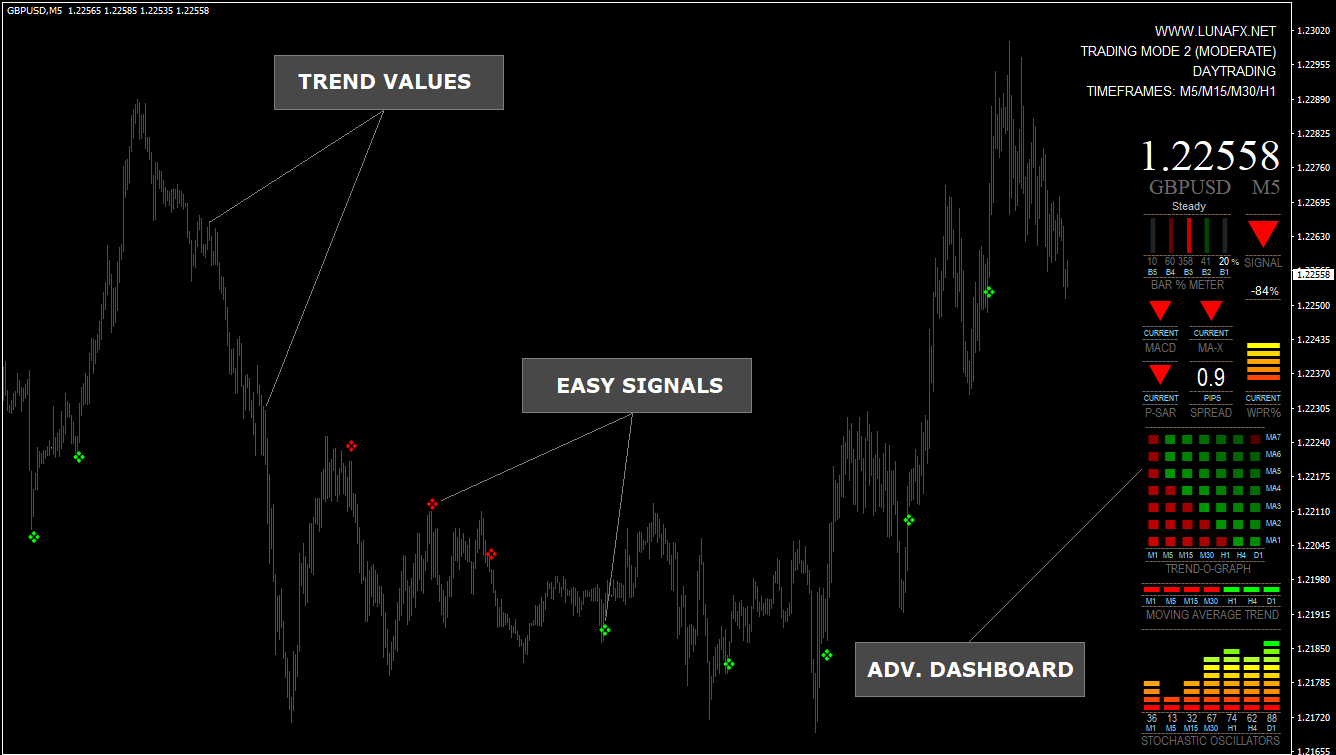
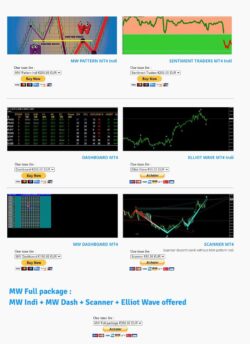
There are four different templates that can be used to accommodate different market conditions and trading styles.
Forex MT4 trading indicators are completely manual. While the indicators provide signals, the trader’s decisions about entering the market and setting protective stops or profit maximizing exit stops will be made by the trader. Traders must understand the concept of risk and reward and be able to enter and exit the market using initial support and resistance zones.
The Non-repaint buy/sell signals indicator will give you trading signals that you can take as they are or you can add your chart analysis to further filter the signals, which is recommended. This system works for all levels of traders. However, it is a good idea to practice trading with an MT4 demo account until your skills improve and you feel confident enough to trade for real.
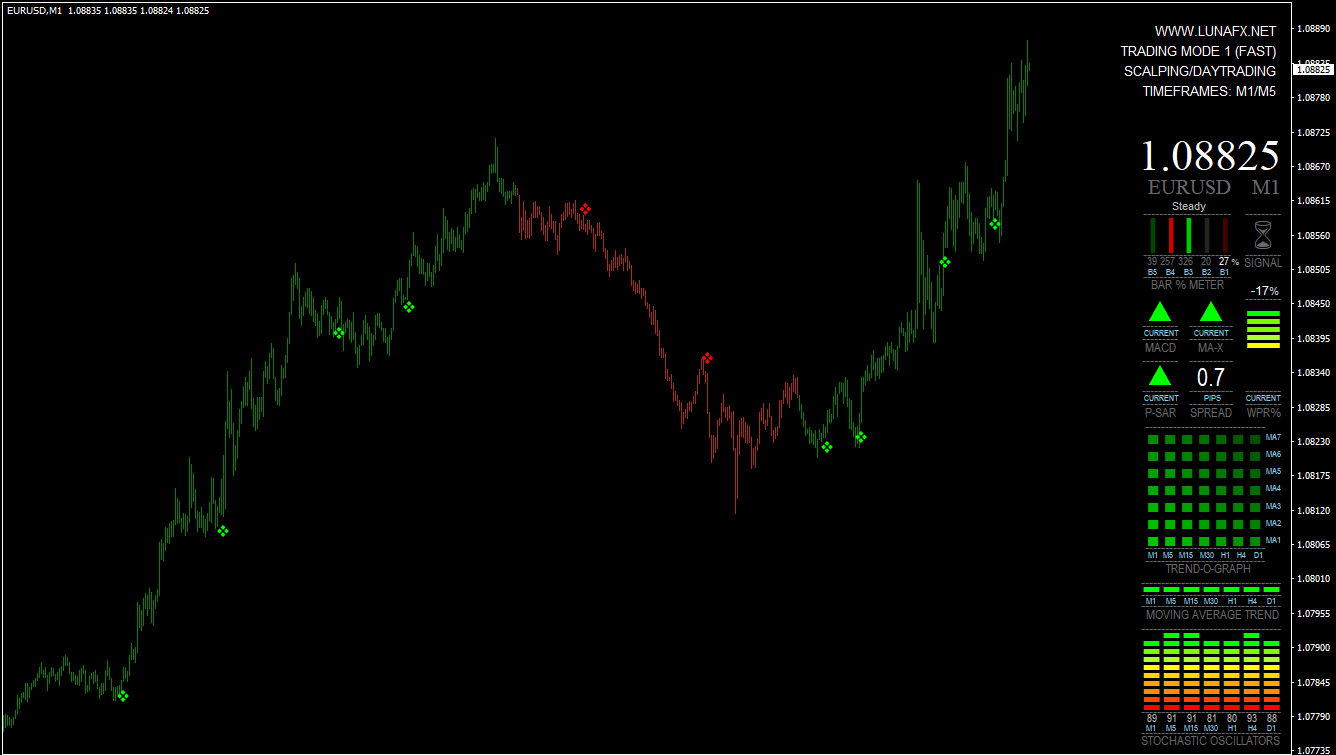
Features of the Non-repaint buy/sell signals indicator dashboard
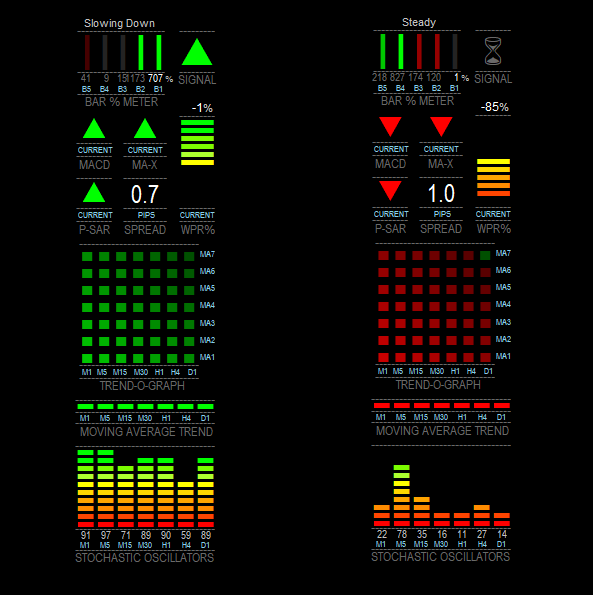
A single indicator that shows all the information you need without the clutter of looking at many charts, indicators or screens.
Chart of stochastic observers for time frames M1 to D1.
A market indicator using moving averages for time frames M1 to D1.
The current chart shows the direction of the MACD and the crossover of the signal and zero lines.
The direction of the 3-period LWMA crossed with the 5-period SMA. (The period can be customized).
To confirm the entry, the chart shows the direction of the parabolic SAAR.
This was selected due to its unique predictive power and fast movement. It is also very useful for identifying overbought/oversold situations.
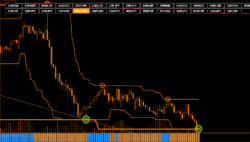
To show the percentage of price increase or decrease, we created a bar percentage increase/decrease table. It is simple and effective. It works by combining the four previous bars movements (close to each other) and dividing them by a percentage. If the current bar is above 100%, it means it is moving faster than the average. If it is below 100%, it slows down and takes a steady movement. A bright red color is a sign of strong price movement
or green, with different shades depending on the strength of the movement.
Based on these indicators, it is recommended that the overall signal of the trade is the one you choose.
Last but not least, the currency spreads in large, easily visible figures.
History viewer, a vertical line that can be dragged over previous bars to bring up the history.
Trend chart, showing customizable moving averages over 7 time periods.
OB/OS signal chart showing overbought or oversold signals for 7 different oscillators/indicators over 7 time periods.
A customizable overall signal that uses a combination of current and multi-timeframe indicator signals.
You can turn on or off the price/chart/currency display.
You can switch between default and compact mode.
The Non-repaint buy/sell signals indicator system is simple and straightforward. This system is easy to use and can be traded even by beginners. It can be set up to notify you via cell phone notifications, platform pop-ups and email . This is a great way to monitor multiple charts at the same time.
The MT4 trading indicator can be used for any Forex currency pair, as well as other assets such as stocks, commodities and cryptocurrencies. It can be used on any time frame you like, from 1 minute to 1 month charts.
It is easy to use even for complete Forex beginners. It is easy to use even for beginners. You can simply load one of the 3 available templates onto your charts.
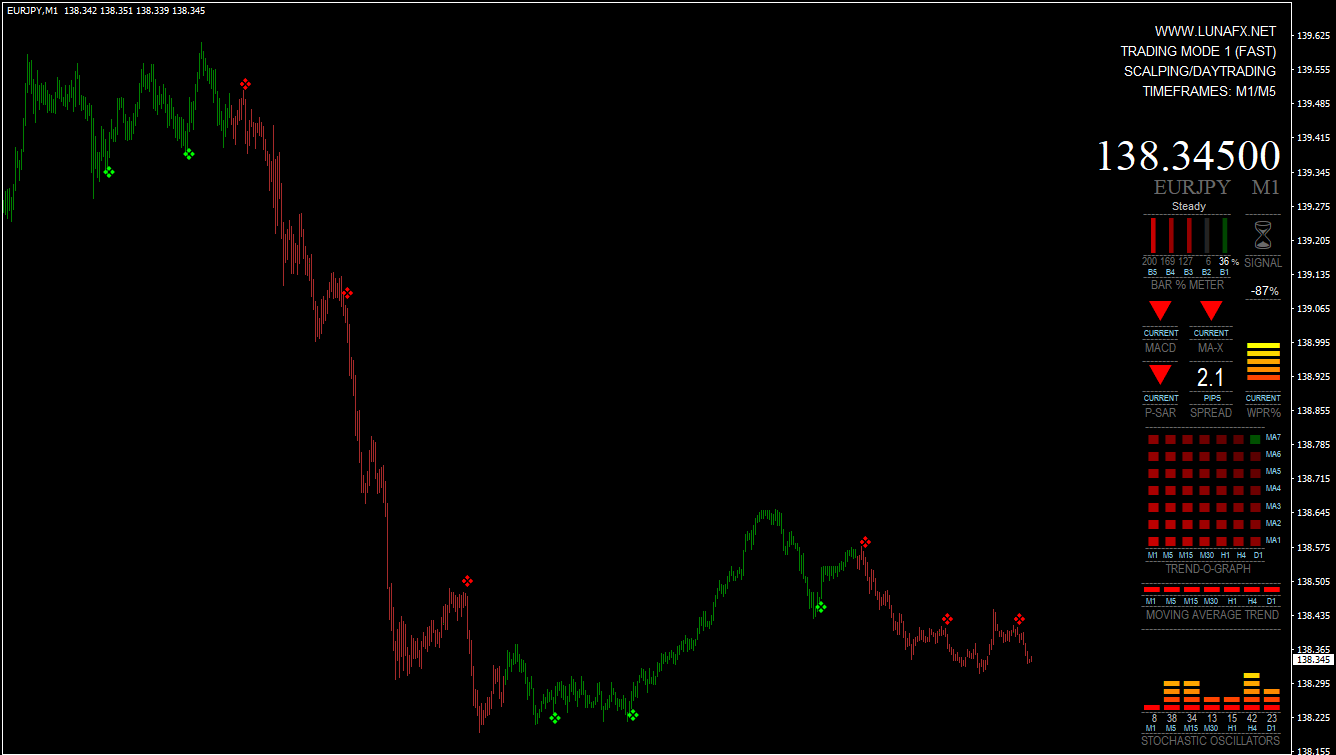
Non-repaint buy/sell signals indicatorM1- is the fastest aggressive template. This mode offers faster signals, but with higher risk. This mode is ideal for scalping or day trading.
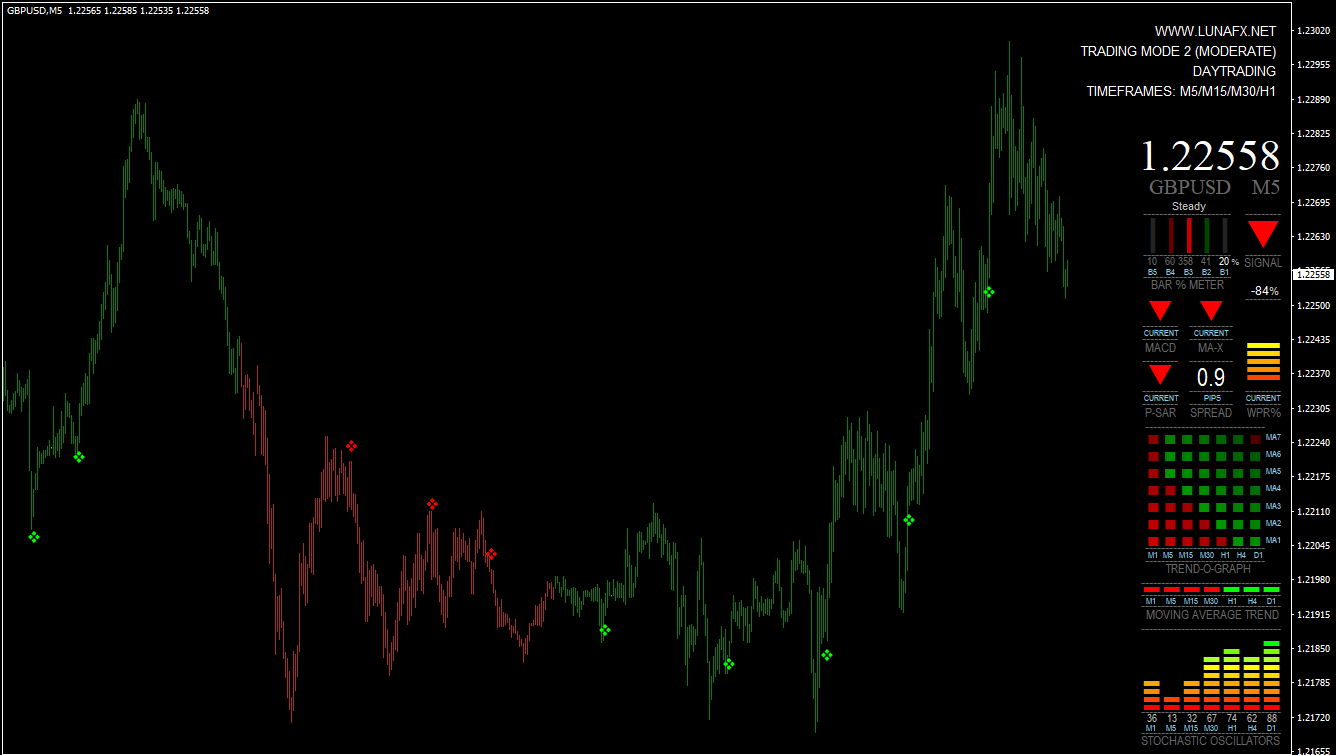
Non-repaint buy/sell signals indicator M2 is the balanced model. Medium risk, medium signal speed. This mode is ideal for swing trading / day trading.
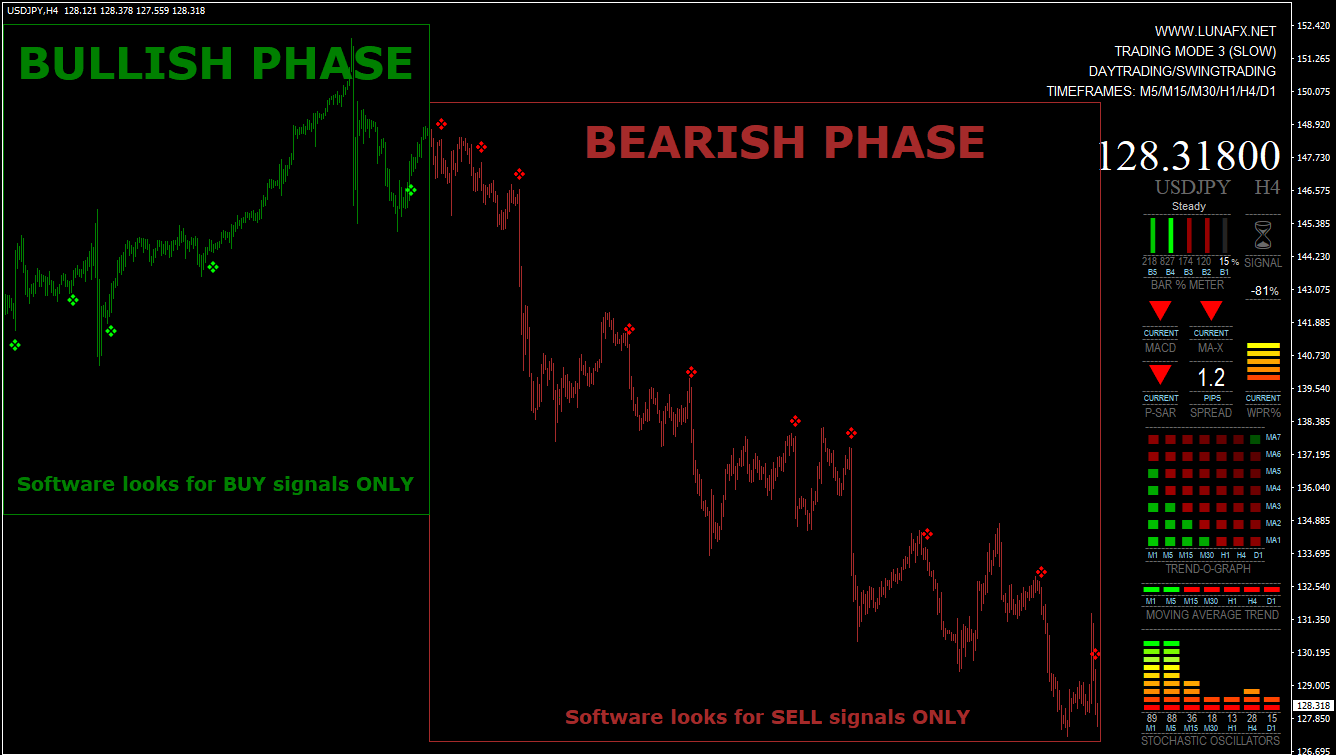
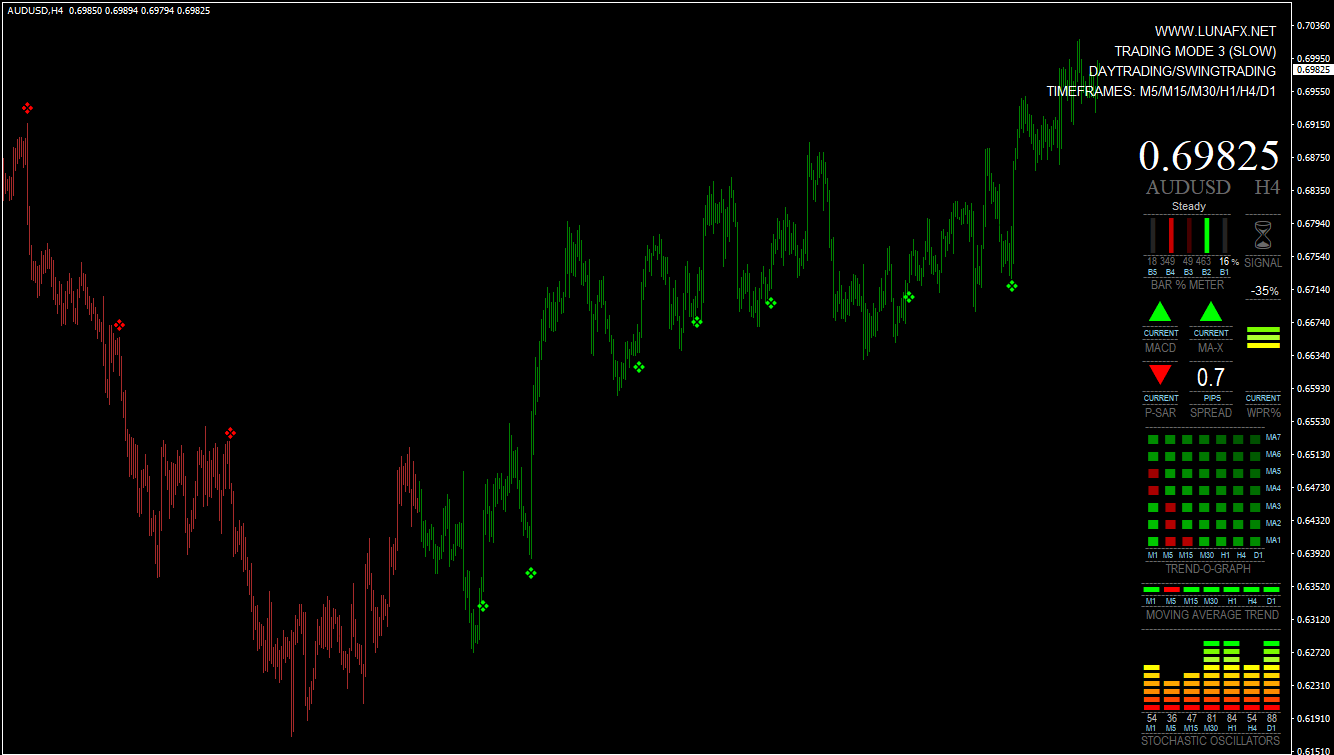
Non-repaint buy/sell signals indicator/M3-is the most conservative signal. This trend is slow and allows you to capture the most important moves at a higher TF.
Trading rules for MT4 trading indicators
Follow money management and do not trade during periods of high-impact news. You should exit your trades within half an hour of high impact Forex news.
Remember to manage your money very well to get great results. You must be disciplined, emotional and psychological in order to trade profitably. It is important to be able to recognize when to trade and when to avoid trading. Avoid trading during unfavorable time or market conditions, such as low volume/volatility conditions outside of the main session, exotic currency pairs, wider spreads, and other conditions.
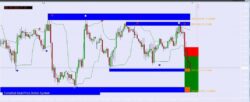
Buy Entry
You can observe that when green candles appear, it is clear that the market trend is bullish, as shown in the chart. These green flags serve as buy signals and they indicate that it is advantageous for the firm to open a position on the buy side.
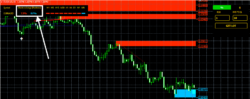
Sell Entry
When you observe red candles, it is clear that the current market trend is bearish, as shown in the chart. These red dots act as sell signals and you suggest that it is advantageous for you to open a sell position.
Trading Presence
In Forex indicators, fixed profit targets can be used to liquidate positions. Alternatively, you can use previous support or resistance levels or high and low levels as reference points to set profit targets. You can also exit a trade manually (i.e. the system is in reverse) if you see a signal to the contrary.
It is recommended to use a stop loss. Set SL below the entry price by using previous support/resistance or previous high/low swings as reference points. It is not recommended to use a fixed stop loss setup without any reference point.
A simple RR ratio can be used. Place the SL below/above your last swing. Your target should be the same number of pips as the last swing (TP1), or twice as many (TP2).
If your SL is 15 points. TP1 should be at +15 points, and TP2 should be at +30 points.