RSI Heatmap Indicator
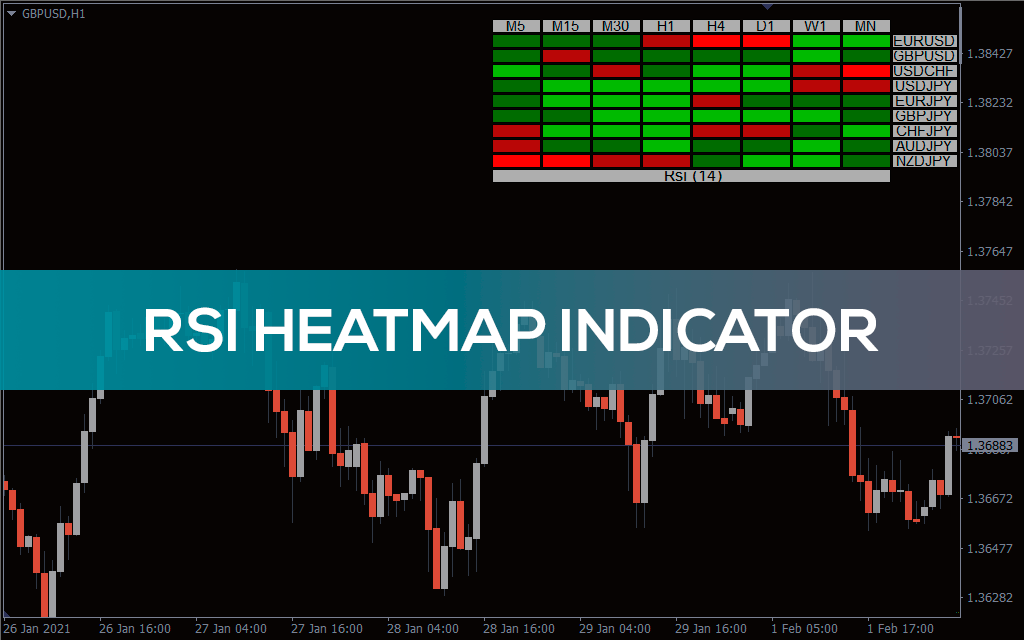
The RSI Heat Map MT4 indicator helps Forex traders to determine the strength of a currency pair. The currency strength meter indicator uses RSI – Relative Strength Index and therefore allows to accurately calculate the currency strength. In addition, they create heat maps with multiple currencies and time ranges to monitor and interpret them efficiently.
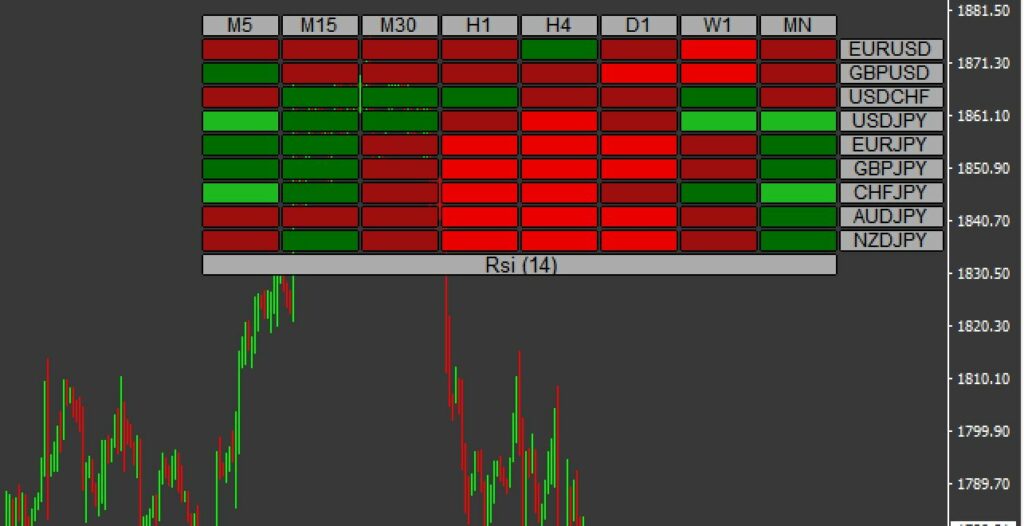
The Currency Strength Meter heat map uses different colors to accurately indicate the various strengths. The Currency Strength Heat Map is available in four different strengths. Based on RSI values and direction of price movement. These different colors allow trading with a clear picture of currency strength in real time.
How to use the RSI Currency Strength Indicator Heat Map for Forex trading?
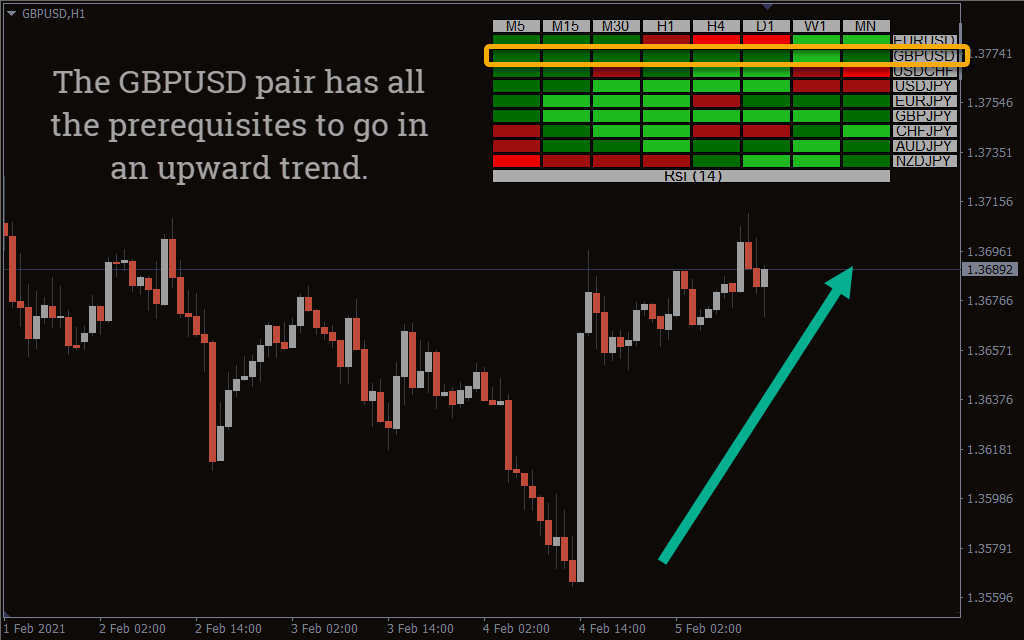
During the rise, if the color of the heat map changes from green to lemon green, Forex traders can place buy orders. This is because, the change in color indicates that the strength of the currency has changed from weak to strong.
On the other hand, when the color changes from firebrick to red, the trader can place a sell order. If the strength color changes from green to lime green in more than one time frame, the
trader can place a buy order. Thus, a color change across time frames indicates a strong signal. Conversely, the opposite is true for SELL orders.
Traders can also choose to list all FX pairs with a common currency to determine the strength of individual currencies. For example, a trader can list all Forex pairs with GBP to identify and monitor the strength of GBP.
Conclusion.
Obviously, the Forex Currency Strength Meter is a terrific MetaTrader 4 indicator. It is very useful for traders who use the strength of currency pairs as a trading strategy. In addition, using RSI to determine the strength of currency pairs will definitely increase the accuracy of this MT4 indicator.
[sociallocker id=24390]rsi-heatmap-indicator.zip[/sociallocker]

Responses