forex heat map indicator

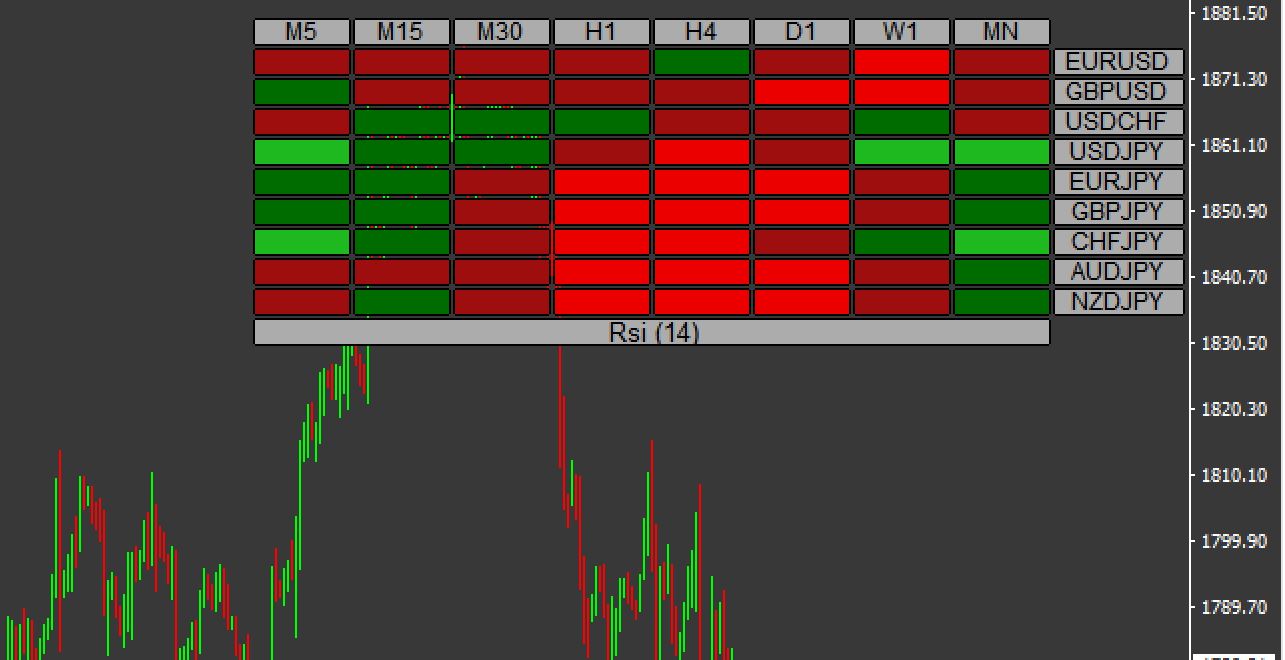
Heat map of the RSI indicator, mt4, to help forex traders assess the strength of an exchange rate pair. This indicator of currency strength utilises the RSI – Relative Strength Index – so that the strength of a currency can be accurately determined. In addition, a heat map is created that includes various currencies and time horizons to help you monitor and understand the data effectively.
The currency strength chart uses different shades to accurately display the different strengths. Their currency strength chart contains four types of strength. Based on RSI numbers and the direction of price movement. The different colours help to give traders a clear picture of the real-time strength of the currency.
How do I use the RSI Currency Indicator’s strength heat map for forex trading?
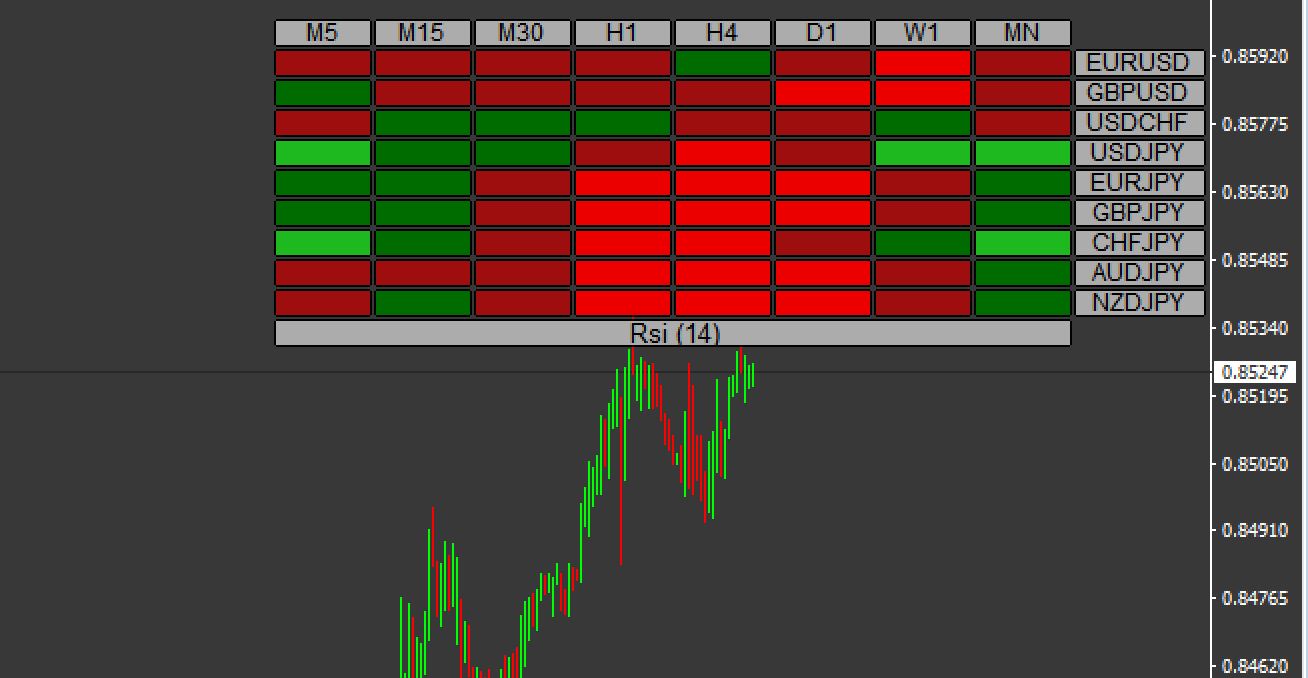
When a currency is rising, a forex trader can place a buy order when the colour of the heat map changes to green and then to lime green. This is because the change in colour is a sign that its strength is increasing between weak and strong. On the other hand, when the colour shifts between firebrick to red, they can place a sell order.
When the strength of the signal fluctuates between green or lime green across multiple time frames, traders can place a buy order. This means that the change in colour across time frames is a signal of strength. Conversely, the opposite is true for sell orders. Orders.
Traders can also list all forex pairs that use the same currency to gauge the strength of each currency. For example, a trader can display all forex pairs using the pound sterling in order to recognise and observe the strength of the pound.
Summing up.
It is very helpful, especially for those traders who use currency strength to determine their trading strategies.
[signinlocker]rsi-heatmap-indicator.ex4[/signinlocker]
[signinlocker]
[/signinlocker]
Responses