Auto TrendLine Indicator

Trendlines are a key tool in classical technical analysis and almost all traders use them. They are easy to draw and very effective. The following factors can cause confusion for traders: frequent redrawing of trendlines, wrong breakouts and too many trendlines that can be drawn to extremes. Drawing valid trendlines is difficult for both experienced and novice traders. This problem can be solved with the Automatic Trendline Indicator.
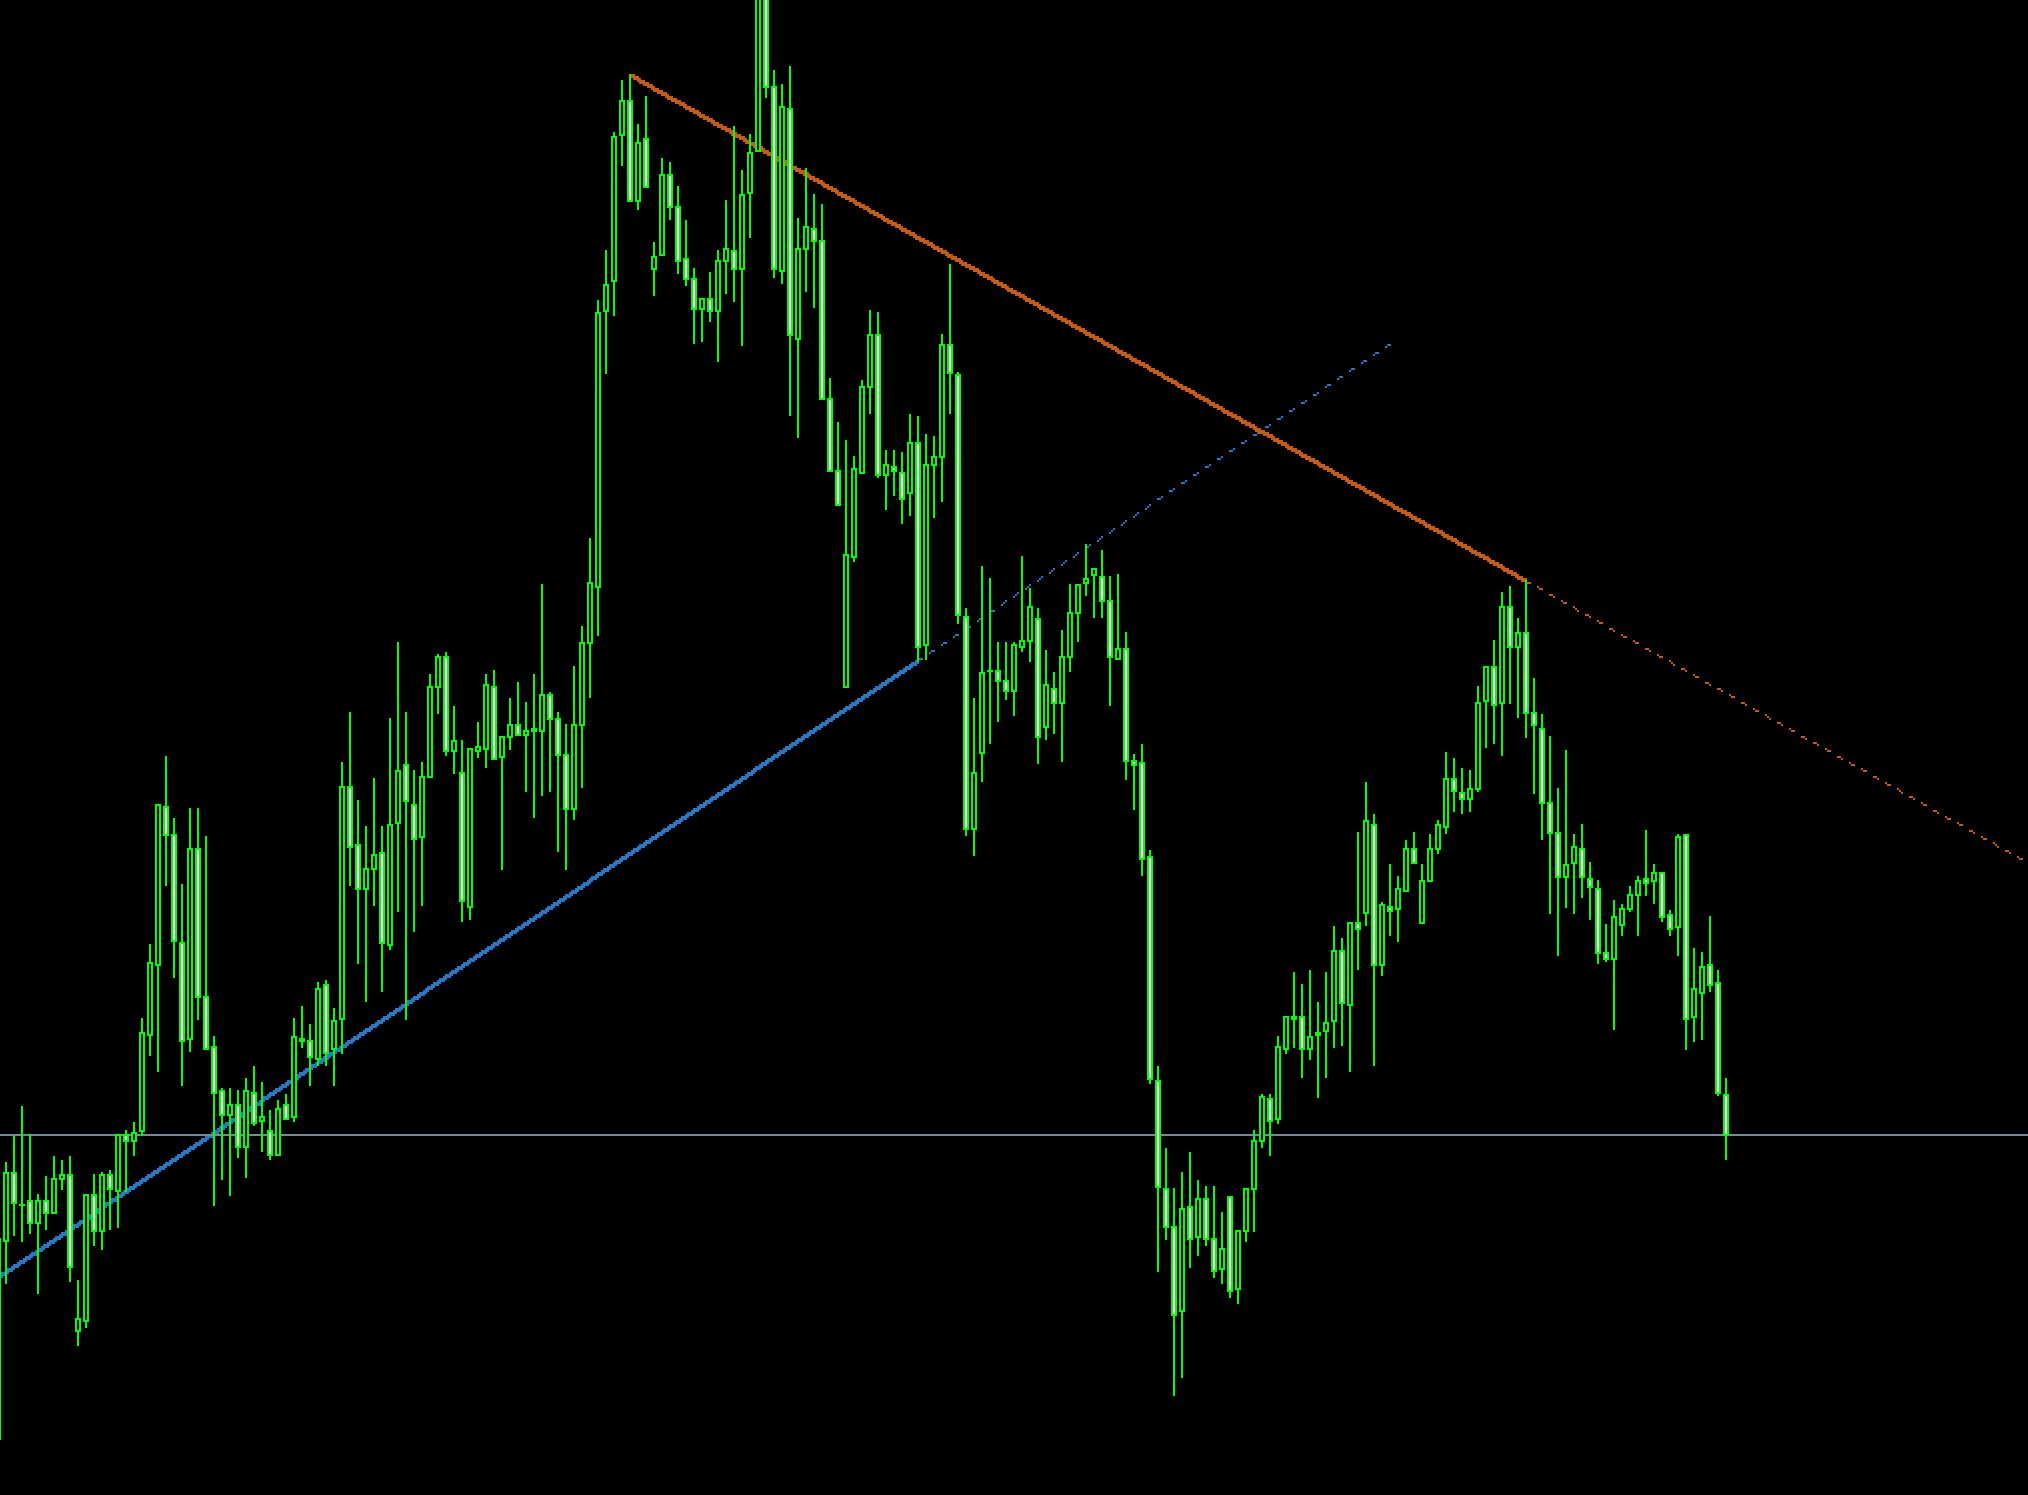
AutoTrendLine Indicator
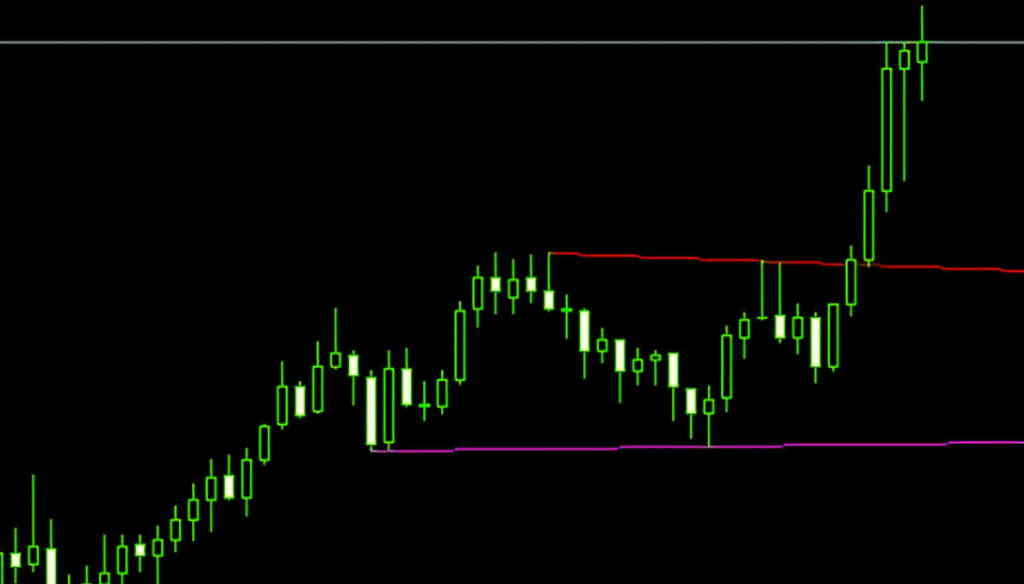
Shows the latest trendline on the chart. The indicator plots only the trend lines with which the price will interact.
The indicator reacts quickly to market conditions. If the price moves to a new extreme, the trendline will adjust its slope. If it becomes the opposite trend or flat, the previously valid trend line will be removed.
The indicator is made up of two lines in the real world. Each line is divided into a current trend (solid line) or a forecast trend (dashed line).
– Blue solid line – uptrend.
– Blue dashed line – predicted uptrend line.
– Red line – downtrend
– The red dotted line – the forecast downtrend line.

What is the importance of trend lines?
The price of an asset traded on the Forex market depends on many factors. Some of these factors are not always easy to explain. One example is the behavior of prices during news releases.
If the volatility of the price movement increases, it is possible to break the trend line. These are common situations, so they are not difficult to understand.
This indicator takes into account almost all price movements. It adjusts the trend line for real breakouts or trend changes.
Therefore, it is simple and effective. This product is useful for both beginner and professional traders.
How to trade with AutoTrendLines indicator?
Trading with the trend has always been considered as one of the best and safest strategies. This is because the vast majority of traders trade in the same direction. This indicator allows you to analyze the charts in detail and pinpoint entry points.
[sociallocker id=24390]AutoTrendLines.zip[/sociallocker]


Responses