Chaikin Money Flow (CMF) Indicator

Chaikin Money Flow (CMF) indicator to determine the flow of funds during a specified period of time, with a default of 21 days. It calculates the flow of funds in terms of combing amounts and prices. The indicator can be used by traders to determine whether investors are collecting assets by buying or selling. When changes in money flow are detected, traders can detect price fluctuations and predict price reversals in advance.
How to trade with the Money Flow Indicator
It is built on the concept that prices close in the upper half of the range every day as market forces grow. Likewise, prices consistently close at the lower end of the daily price range, indicating that market forces are weakening. Therefore, the indicator was created to detect the market trend.
The indicator’s value increases as the currency cross approaches the intraday peak. It decreases when the closing price is close to the intraday low.
The purpose of the indicator is to move between -1 and 1. If the indicator is in the positive zone, then the market is under bullish pressure. When it is in the negative zone, the market is also experiencing a bearish push.
How do you trade with this indicator?
Buy Signals
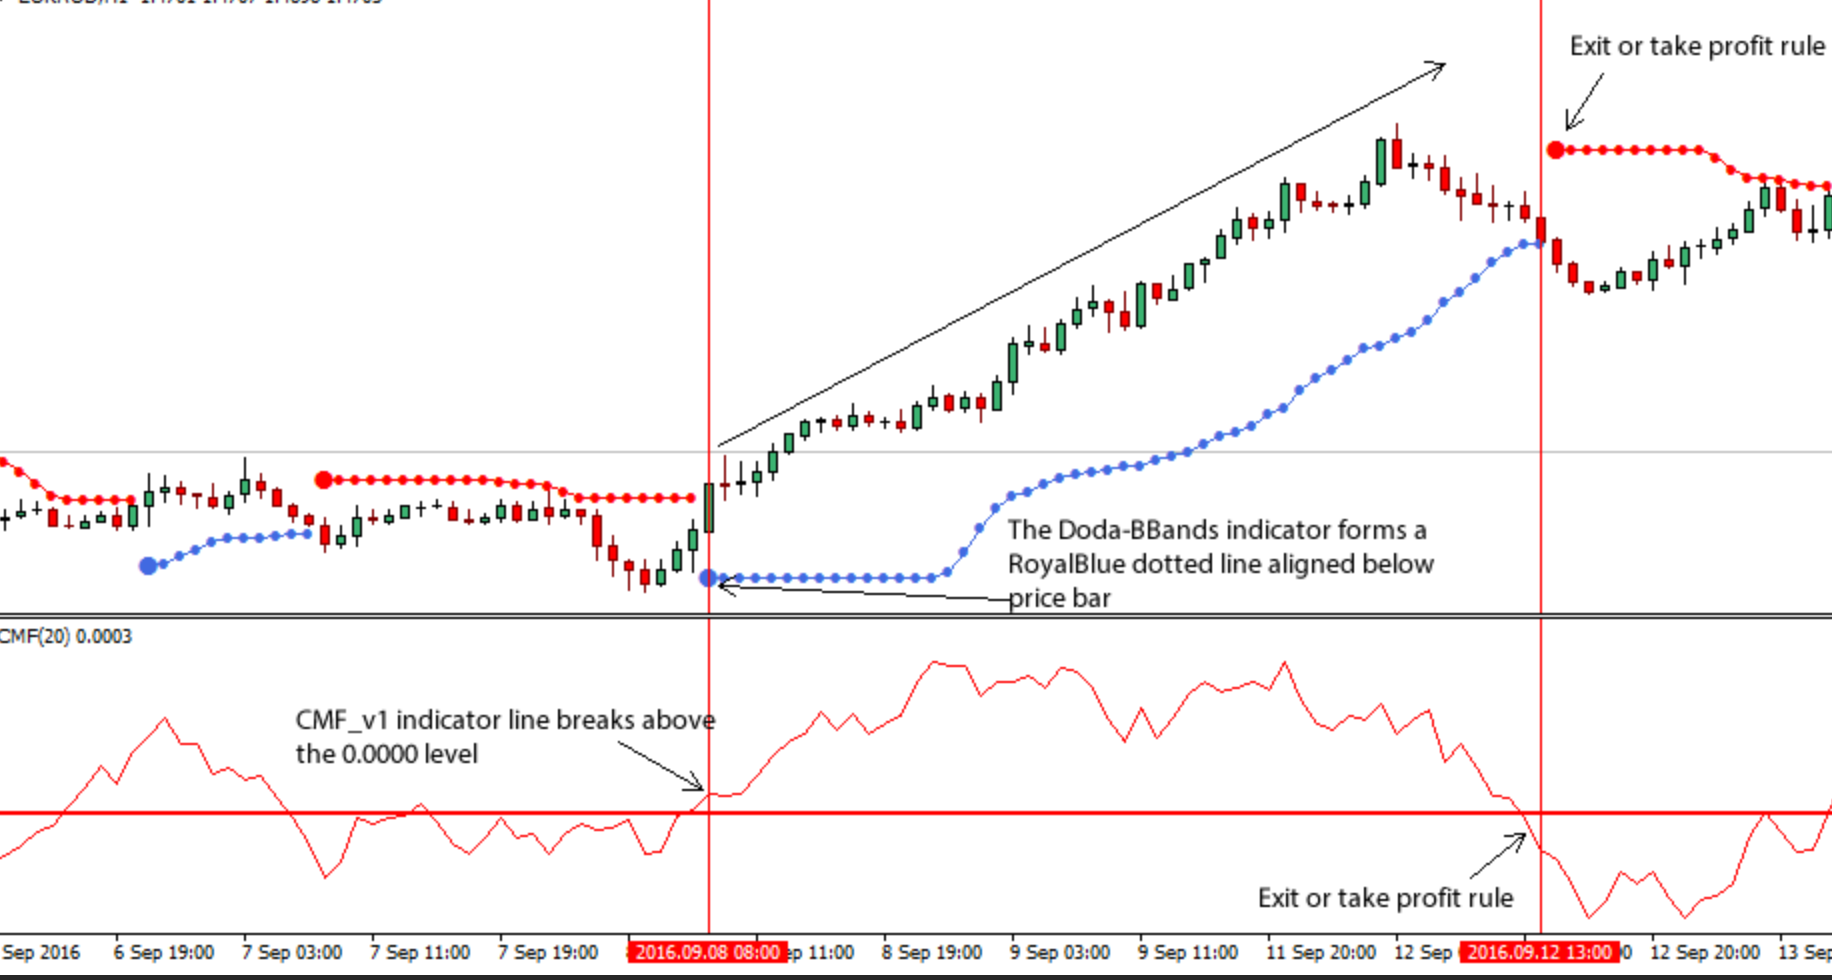
When the reading is above the zero line, the indicator is a positive signal. This means that the market is growing and you should buy. In addition, the value of the indicator should increase as the price rises. A bullish signal is an indication of buying pressure, which is accumulation.
Selling signals
A negative number (below the zero line) means that the market is weak or a bearish signal. Therefore, it is recommended to try to sell. The value of this indicator decreases as the price falls. Sell pressure is the indicator assigned.
Note how the indicator values change from positive to negative as prices fall. A closer look at the price chart shows that the EUR/USD candlestick has closed close to the lows of the session.
In the same way, when the uptrend is in the direction of the indicator values rise. In addition, the price is close to the high of the period, so the indicator’s rising line. In reality, the indicator line is moving up to the highest level as the price approaches the resistance level.
Chaikin Cash Flow can be one of the best indicators of trading trends. It tells investors that traders are building assets through purchases and sales. Thus, they are able to identify the strength of the current trend. Moreover, it can help detect trend reversals. Similar to other indicators, it is the best to use.
[signinlocker]chaikin-money-flow-indicator.zip[/signinlocker]


May I please have the CMF indicator