Fibonacci Retracement Indicator
As you may have seen, due to the high volatility of the market, it is difficult to distinguish between trend waves and retracement waves. Forex market.
To solve this problem To solve this problem, a no-cost Fibonacci retracement indicator has been developed. It can be found here.
1. Description of the Fibonacci Retracement Indicator (Fibo)
This indicator will automatically draw Fibonacci levels (Fibo extensions) on the MT4 chart. By doing so, it eliminates any “flat market” phases and considers only the phases of price movement.
Fib extensions help to determine the depth of potential retracements (pullbacks) relative to the main direction of the trend. By using these levels, it is possible to identify the location (or pivot points) of pivot points where a previously started trend may return.
The basic idea behind Fibo levels is that the more pronounced the retracement, the greater the chance that the pivot point will occur in the direction of the current trend.
Description of Fibonacci levels
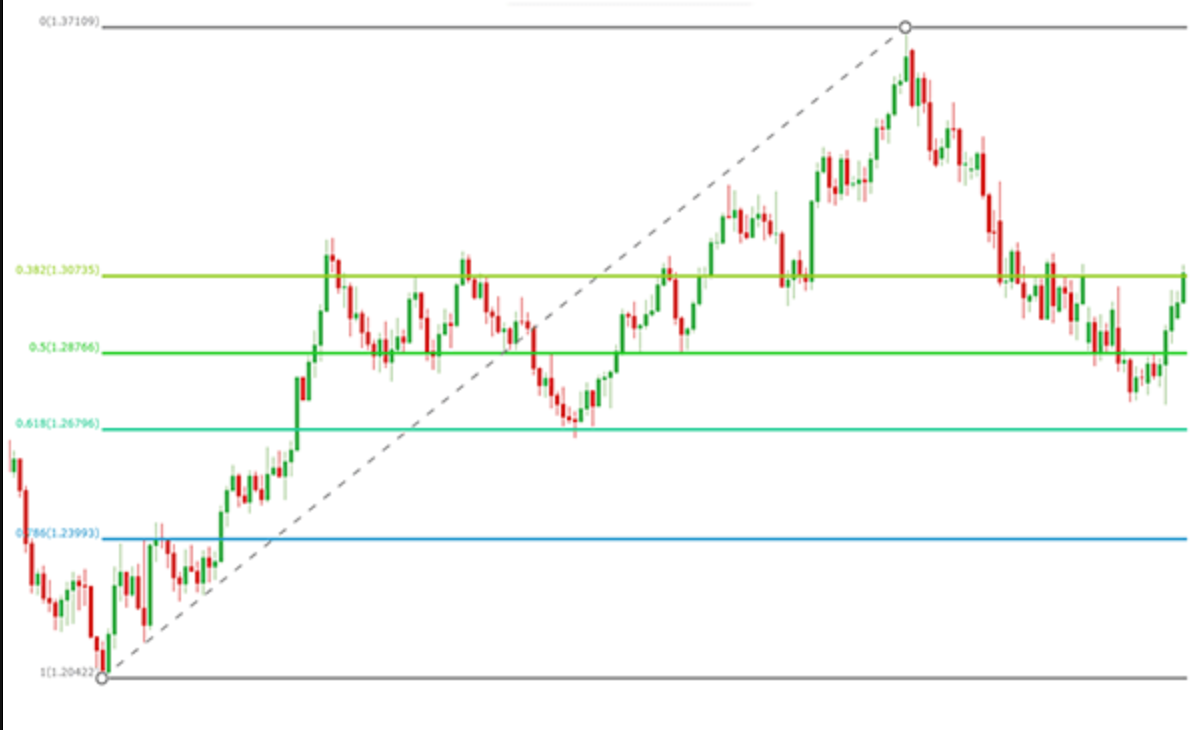
Fibonacci extensions are shown as a percentage. Fibonacci extensions are expressed as percentages and are calculated as follows: set to the Fibonacci grid (displayed as a number from zero to 100%), showing percentages between 23.6, 38.2, 50.0 and 61.8. The resulting values will be used to create Fibonacci levels (they are the number 6).
100% is the basis for Fibonacci level positioning.
61.8% is also known as the “Golden Ratio”. This is a good complement to the 50% level. If the retracement wave slows down at these two levels, it is easier to predict when a pivot will occur.
50% Most pivots occur around this level. This is because short term traders lock in profits on their positions as they trade retracements.
38.2% Pivots approach this threshold when traders are engaged and confident.
23.6% Pivots rarely occur close to this mark. Market participants in the Forex market often look for deeper pullbacks to determine entry points.
0% This value is the end of the Fibonacci level placement.
If you use other indicators of Fibonacci levels, it is possible to observe a level of 78.6%. Generally, retracement waves fail to reach this value. This can be explained by the nature of the current tendency towards strength, i.e. compared to higher levels. This is why the 78.6% extension level was removed from the indicator FiboRetracement.
In addition to the general description of the level, you must take into account each specific situation you see on the chart. If there was already a strong trend before the retracement and the retracement was weak, then you have a better chance of recovering the trend.
If the retracement is stronger than the main trend, then the retracement is likely to become a new, opposite trend.
In addition, if the Fibo levels are consistent with the round numbers (see our freely available RoundLevels indicator) or any other analytical tool, the chances of regaining the trend are even greater.
How do I use this indicator? Fibonacci Retracement Indicator
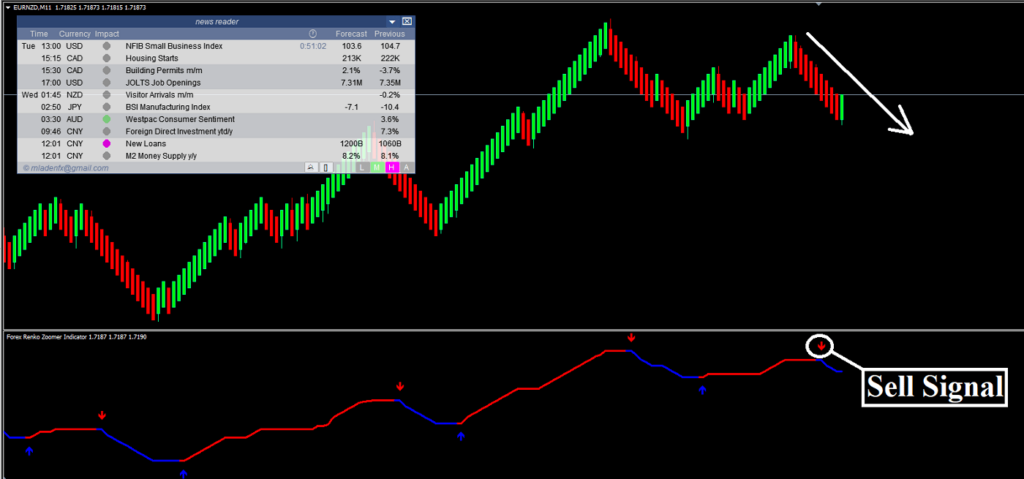
We recommend using Fibonacci Retracement as an additional component of your trading plan and in conjunction with other indicators. The more signals that indicate the need to open an account, the greater the chance of a successful trading outcome.
Let’s use one of the most important tools of technical analysis – trend lines as an additional indicator for trading. In order to do this, we have to download the no-cost AutoTrendLines indicator.
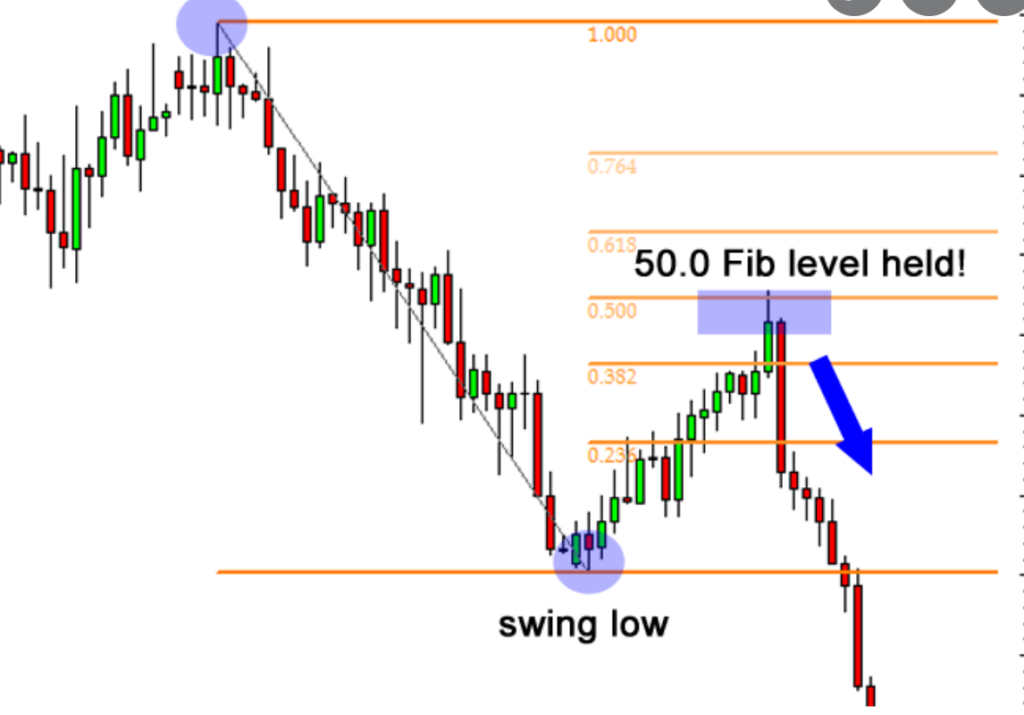
In the chart below, it is clear that the retracement is no longer able to expand to those Fib values close to 61.8% and 50.0%. The above chart may indicate the first signs of a pivot point and the beginning of a sell-off.

Compared to the sell, this retracement is only at the 38.2% Fibo level. This shows that the participants in the Forex market still have confidence and make regular purchases.
In this case, you are able to trade at the current market price, but the stop loss line should be placed above your support line.
If you switch between time frames, it will not allow the level of the indicator to be updated. This problem can be solved by double-clicking on the indicator , and eliminating it. The indicator will run in automatic mode within the specified time frame.
[sociallocker id=24390]FiboRetracement.zip[/sociallocker]


Responses