Sale!

Fibonacci Golden Zone MT4

$29.98

-
+

Specs

Categories: ,

Description

The Fibonacci Golden Zone is something that very few traders know much about.
In fact, the 38.2, 50, 61.8 lines have all been proven to be the best retracement lines to use with the Fibonacci Indicator.
And better yet…
Most Big Bank Traders use Fibonacci as their primary tool to analyze price reversal and retracement zones.
Which is why we came up with our fibonacci golden zone system and strategy…
This Question Changed Everything…“Why Not Develop a Fibonacci Indicator with the Golden Zone Strategy?” 
After reviewing the strategy one day, one of our team members at Trading Strategy Guides asked, “Why don’t we develop an indicator for the Fibonacci golden zone strategy? It is one of our best and simple strategies and honestly I have yet to find a good Fibonacci indicator that actually worked….”
This question changed everything…
 
It really got us to do the research and, to tell you the truth, we found nothing but junk systems!
The indicators we found were useless and they had no info or strategy to back it up.
They were broken and left you confused and frustrated that you even wasted the time to download it in the first place.
So we gathered our team together and collectively decided that the golden Fibonacci strategy will get an indicator…
Now we have what we think is the #1 Fibonacci Indicator tool for every market trader since it is not only backed by a successful strategy, but also, because on all the unique features we implemented into this indicator!
Let us explain why this is the best Fibonacci Indicator on the planet right now.
Discover Why the Fibonacci Golden Zone Indicator is the Most Advanced Indicator on the Market Today- A True Masterpiece
Let us take you on a tour and show you many of the unique benefits the Fibonacci Comes with that makes it like no other indicator on the market today.
Fibonacci Golden Zone MT4
As you can see, the Fibonacci Golden Zone Indicator automatically applies the correct fibo placement 100% of the time.
 
You also get a custom Trend line that is implemented on every Fibonacci placement along with the golden zone indication so you know exactly where you need to be making trades based on our powerful strategy.
Feature #1- Trend Lines
Fibonacci Golden Zone MT4
The Fibonacci Golden Zone Indicator also shows you the previous Fibonacci Zone because these lines are still valid.
All other Fibonacci Indicators will not show you this, but we know how important it was based on the strategy which is why we added this feature into this indicator.
Feature #2- Previous Fibonacci Zone 
Fibonacci Golden Zone MT4
You will also see the exact Fibonacci Level the current price action is located.
Feature #3- Current Fibonacci Level
Fibonacci Golden Zone MT4
The above features are great, but the One of most powerful tools that is implemented into the this system is the Fibonacci Custom Dashboard.
Fibonacci Golden Zone MT4
You can see a small chart image for each time frame with this dashboard with the Fibonacci Indicator attached…
So that means you can see where the exact price action is from a M1 time chart all the way up to a Monthly chart. That can be the difference between a winning trade and a losing trade since you know exactly where the price action is on all of these time frames!
Multiple time frame analysis is very important to analyze with every trade, so this custom dashboard makes it that much easier to do then ever before!
You just heard all of the unique features but we want to break it down even further and show you why having an automated Fibonacci Indicator is better then manually implementing fibonacci lines on your charts.
Why Our Automated Fibonacci Indicator is  Better for Your Trading Success
When you sit down and think about how much time you have spent in your trading drawing line after line on your charts you might be surprised.
Think about this…
If you have been trading for 5 years.
And you have spent 1 hour a day drawing Fibonacci lines, trend lines, and all that nonsense on all of the markets you trade…
You would have spent 1825 hours or 109,500 minutes drawing, deleting, redrawing, ect. Fibonacci lines on your chart.
So let’s use this exact same example but now instead if doing it manually you throw on our Fibonacci Golden Zone Indicator…
So this time let’s use the same example and say you have been trading with the our Fibonacci Golden Zone that required no drawing but simply just adding it to your charts for 5 years…
According to our calculations you will spend a total of 1 minute and 30 seconds drawing, redrawing, deleting, etc. Fibonacci Lines on your charts.
Meaning that the only time it took for you to do all these tasks was implementing the indicator on to your charts.
That means you would have saved a total time of 109,410 Minutes by using the Fibonacci Golden Zone Indicator!
 
Now if you are that dedicated and have spent that much time you must be a master of drawing Fibonacci lines right?
Well, you may be good but are you 100% accurate good?
 
Let us show you a few examples of our Fibonacci Golden Zone Indicator on many time frames and different markets that it placed the Fibonacci lines perfectly:
Fibonacci Golden Zone MT4
Why is it critical for your trading success that the Fibonacci Lines are placed perfectly 100% of the time…
Well…
We recently did a short survey and found that 68% of traders do not know how the Fibonacci sequence works and where to place the Fibonacci levels.
So even if they wanted to use this powerful tool, they cannot because they did not have the knowledge and understanding to do so.
 
Let’s take a look at the advantage of Automated Fibonacci lines Compared to Manual placing Fibonacci Lines:
Fibonacci Golden Zone MT4

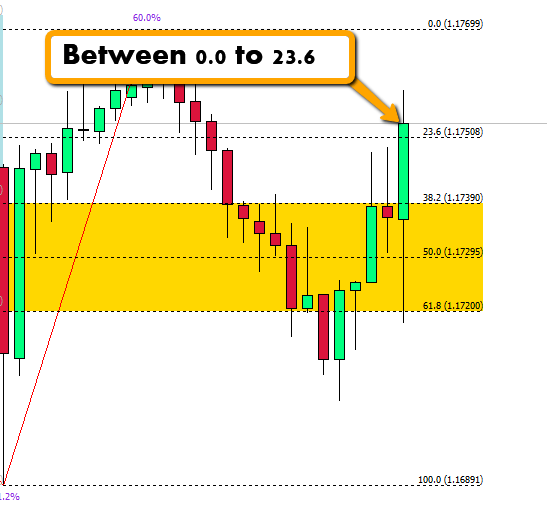
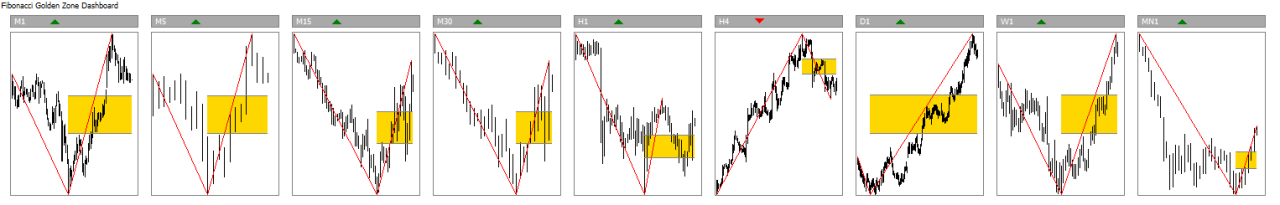
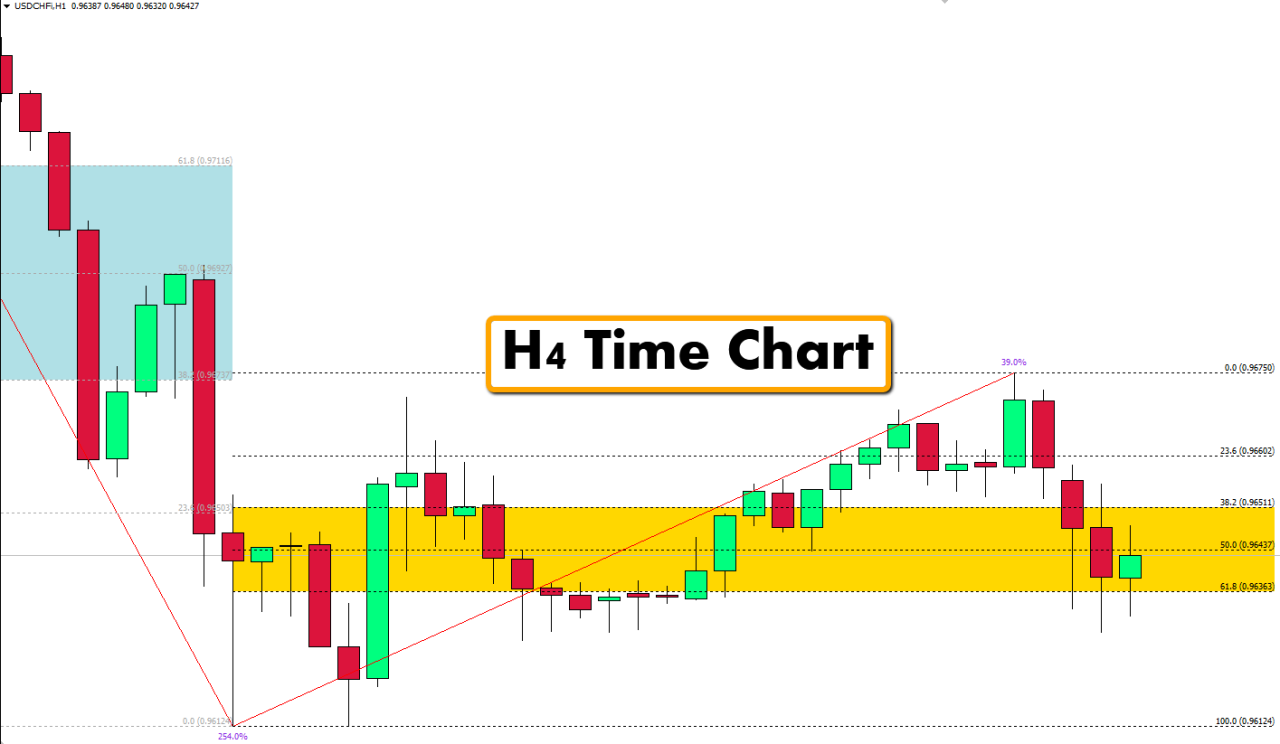
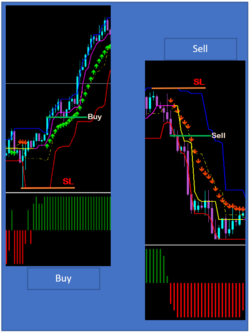
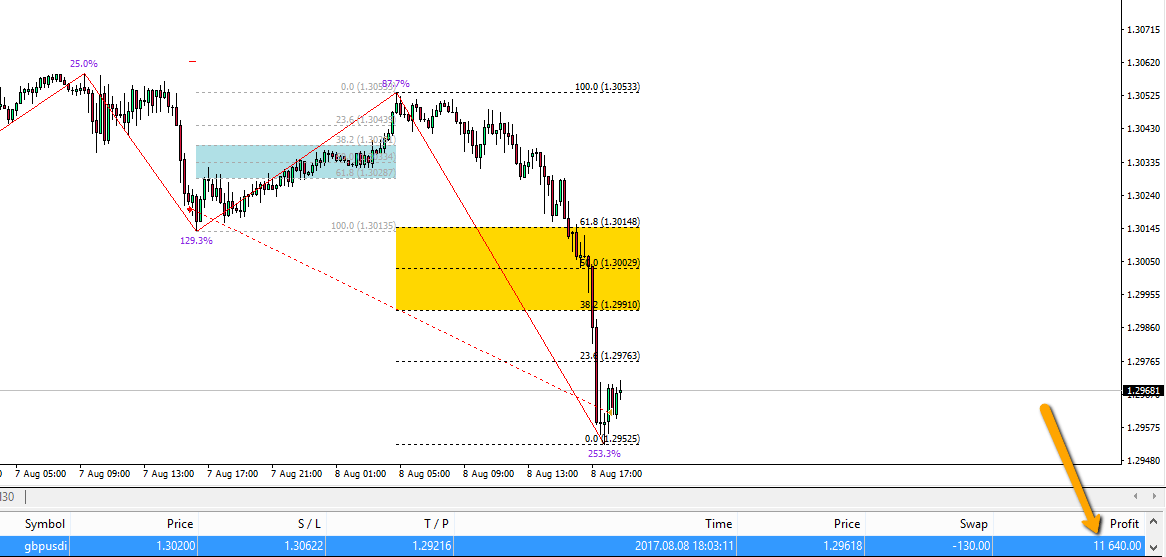
In the above example, there has not been a signal yet to sell with the Fibonacci Golden Zone Indicator.

With manually putting on the Fibonacci Lines, there was no signal and no way of knowing when to trade this.
Fibonacci Golden Zone MT4

In the example above, the rules of the Fibonacci Golden Zone Strategy have not been met so there is no trade triggered.

If you were to manually add the Fibonacci there was no real sign that you should trade or not trade.
Fibonacci Golden Zone MT4

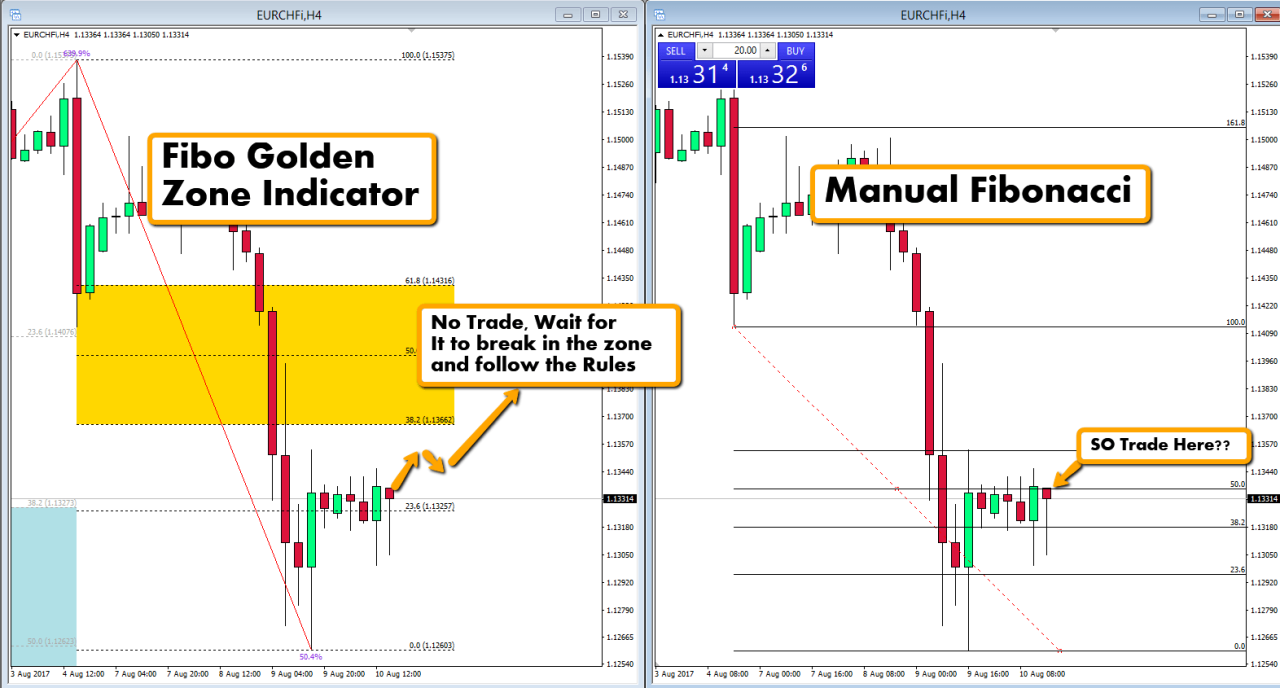
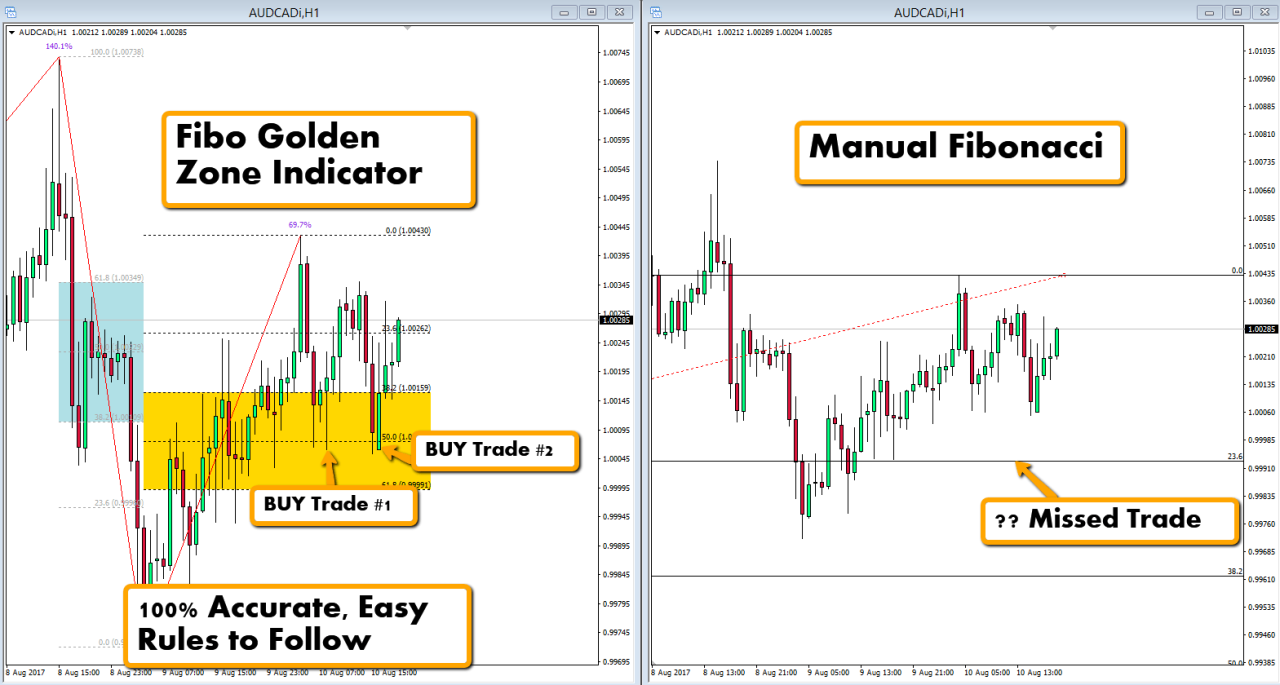
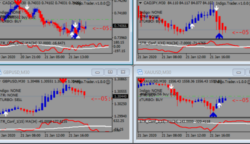
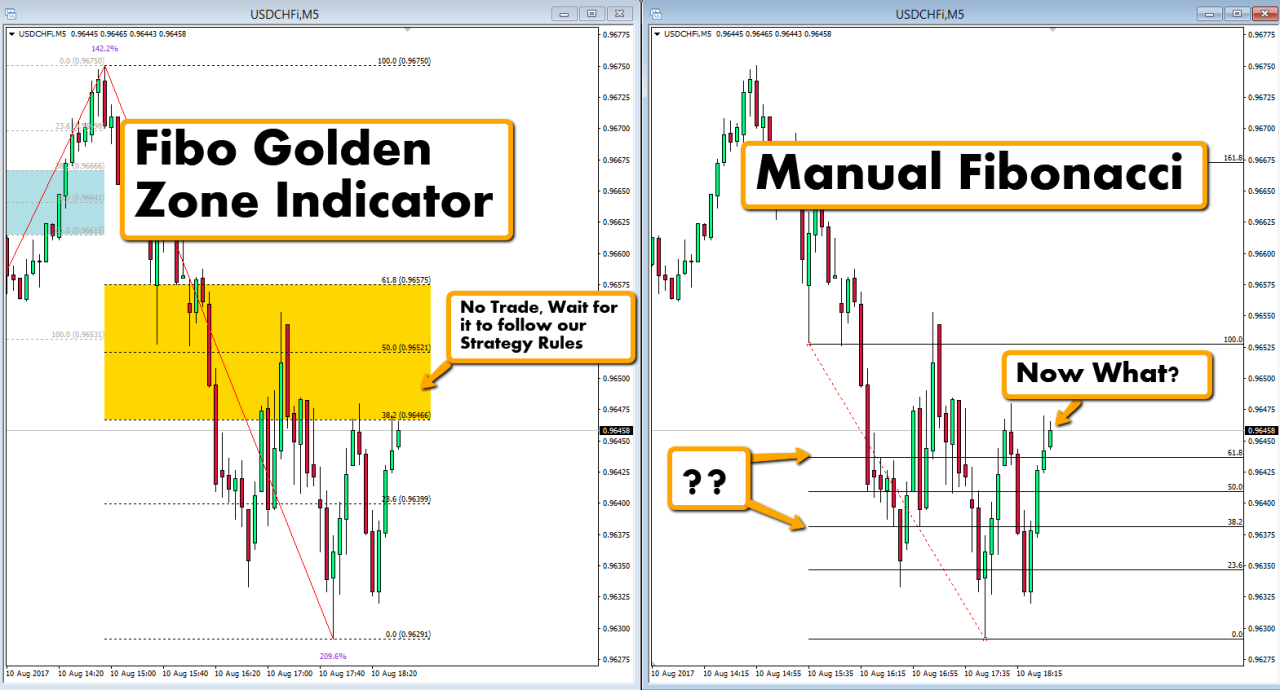
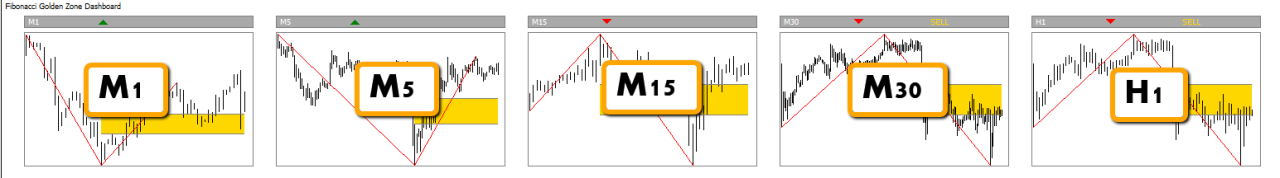
You see in these four examples how much easier and less work it is to find pullback trades with the Fibonacci Golden Zone Indicator?

Plus we have the easy-to-follow step by step rule set that you learn in our Fibonacci Golden Zone Strategy.
Making Money Trading Is NOT Made Just By Working Hard—It is Made by WORKING SMART!

Most of the time you have been told in your life that the harder you work the more money you will make. There has been people in your life say that if you do this one thing (work very hard) you will reach most of your life goals…

Think about this…
How many people do you know work 12 hour days to support their family?
And how much are they earning?
A $2000 check? Or a $4000 check?
 
Now let’s turn that around and ask this…
How many people you know that bring in $2000, $5000, even $6000 by working very little?
We bet none at all!
The bottom line is this….
There is absolutely nothing wrong with working hard.
Our Team knows several people who work over 60 hours a week to support their family and we do respect that.
But there is another option to work those long hour shifts and spending days away from your family because of work to support your family…
We want you to know that the Fibonacci Golden Zone Indicator is developed to not only save you time but also help you pull in profits that far exceed that 12 hour shift or that $4000 paycheck…
In fact, just one single trade taken with the Fibonacci Golden Zone Indicator can make you thousands of dollars..
Fibonacci Golden Zone MT4

It’s incredible how times change… and its incredible how one great discovery can change a whole life!

We know that the Fibonacci Indicator simply works and performs consistently and can change your life forever….
The benefits are endless and it allows you to work “Smarter” and not “Harder”
Did We Mention The Dashboard Scans Every Time Frame On Your Chart?
Fibonacci Golden Zone MT4

The Fibonacci Dashboard is equipped with specific charting images on each time frame all the way from the minute chart all the way up to a daily chart.


There are many ways to use this Powerful Dashboard…
As you see above, that is 36 charts that show you the Fibonacci golden zone indicator…
This could be very helpful if you just want to step back and analyze these pairs.
Or if that is too much to process you can stick with throwing the Fibonacci Indicator on two charts..
Like this:
Fibonacci Golden Zone MT4

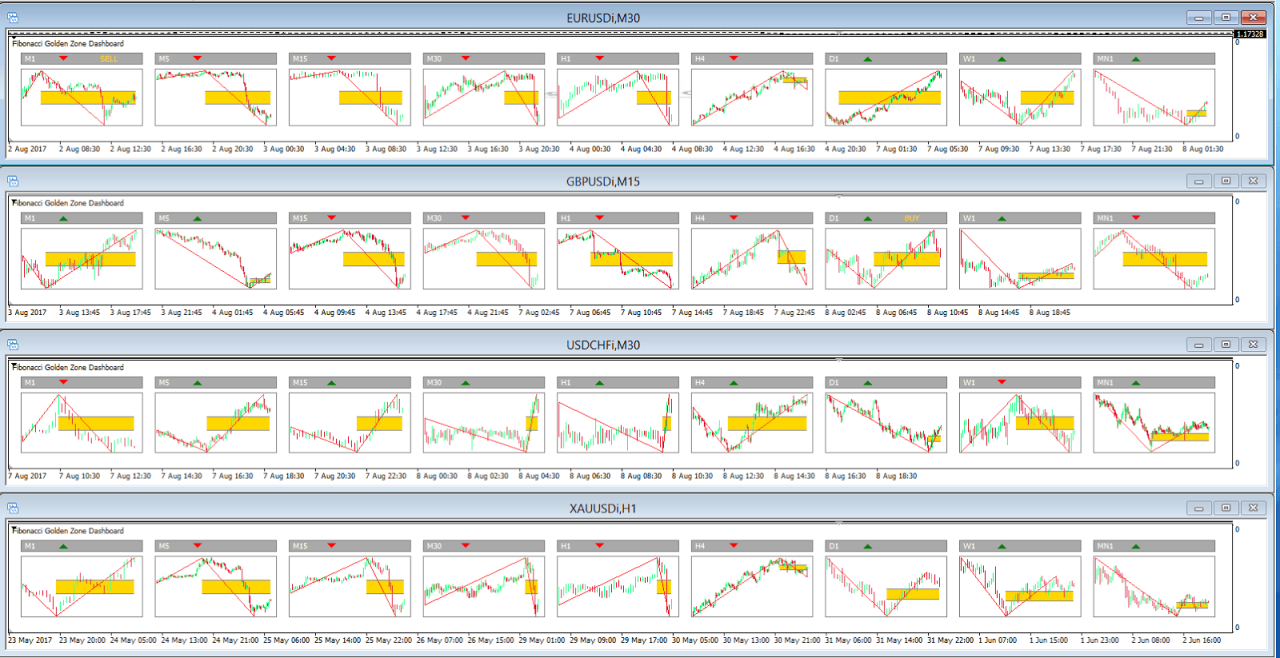
This is fully customizable and give you, the trader, the ability to pull whatever market and whatever time frame you wish to trade!

If you only want to see certain time frames… We got your back!
Fibonacci Golden Zone MT4

You can limit what time frames you want to see the Fibonacci Dashboard…

This is certainly a “wow” factor and something that we knew we HAD to implement.
We know that once you start using this dashboard with this incredible indicator you will understand why we feel this indicator is one of our best yet!!
How Nice Are Trading Alerts? Check This Out!

We all have busy lives and busy schedules and we know that you just cannot be staring at your charts all day long..

Fibonacci Golden Zone MT4

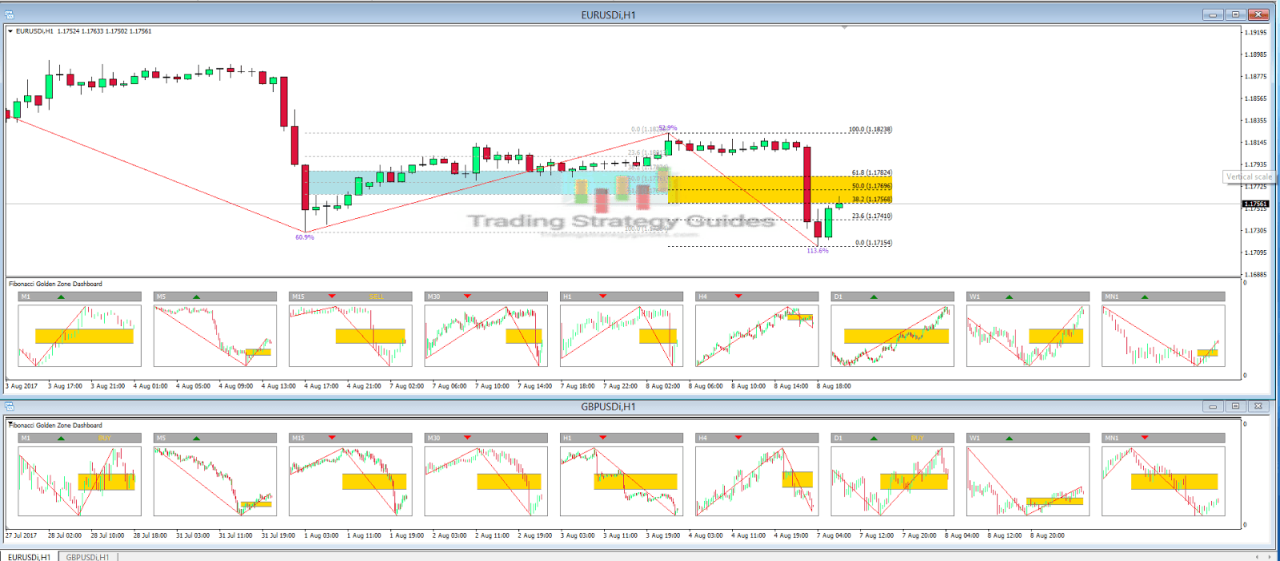
So you know precisely where the price action is at all times! This is a huge benefit because there are countless times we would have missed an entry but did not because we got a pop up alert.

You fully customize this alert so appear just once or many times if the price action is in that golden zone we tell you about in the strategy.
We look at our Fibonacci Golden Zone alerts like alarm clocks in the morning.
 
The alarm clock dings specifically when the criteria is bet and it is time for you to get up and start your day…
Same can be applied to these alerts. You only get the alerts when a certain criteria is met that way you will not miss a possible trade entry if you were busy doing something else.

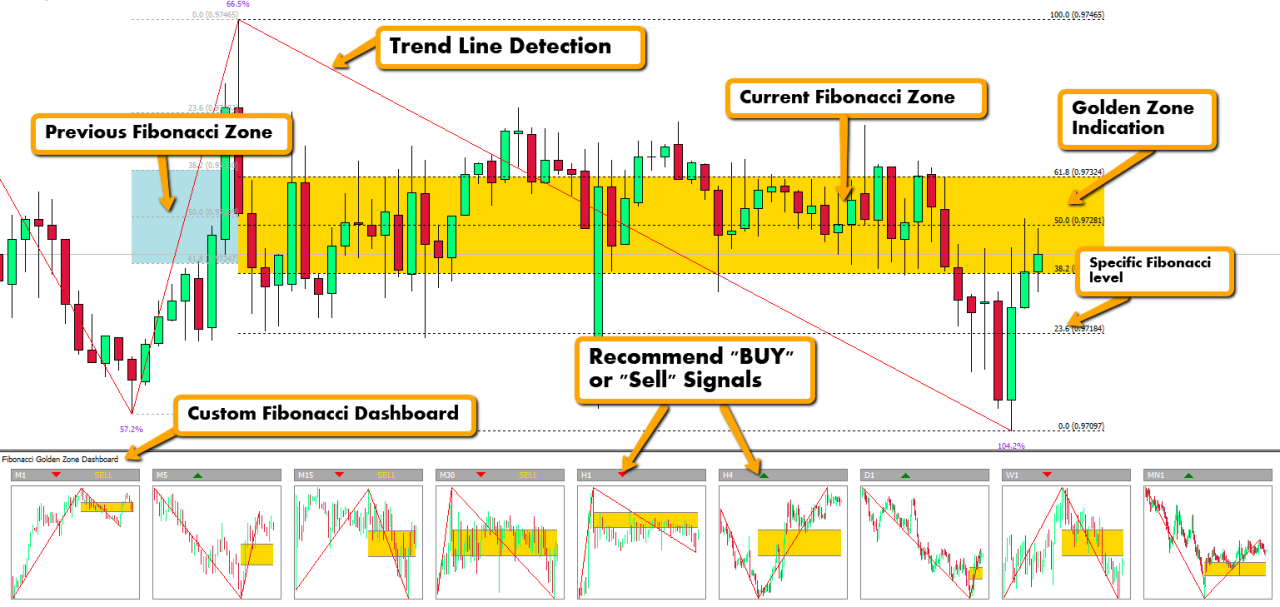
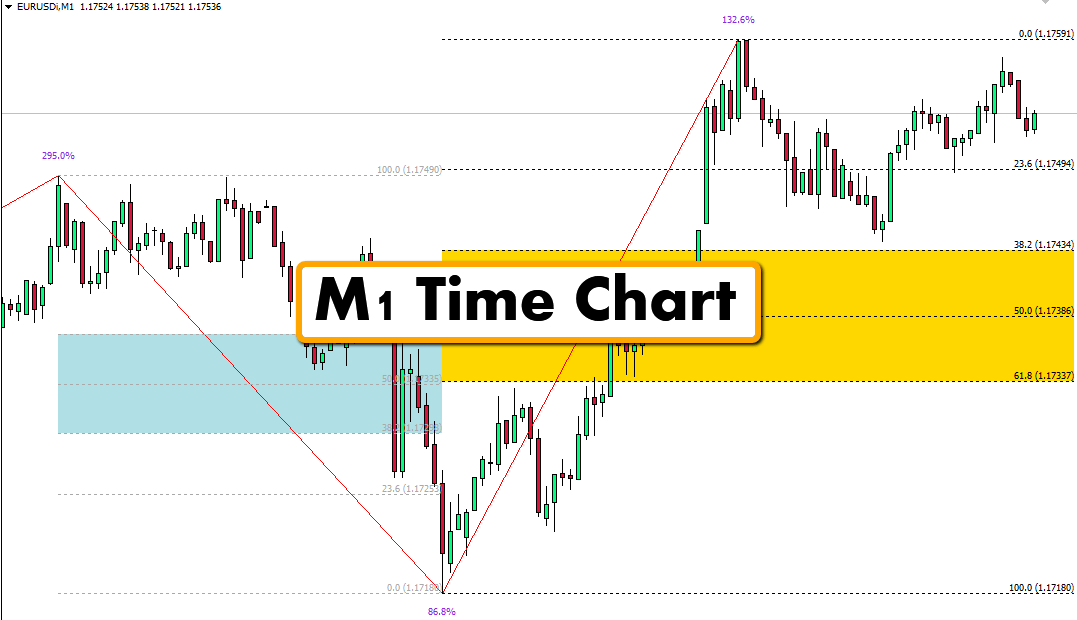
The Fibonacci Golden Zone indicator for MT4 automatically plots Fibonacci retracement levels on a price chart and highlights the key “golden zone” areas where price activity is anticipated based on the established Fibonacci ratio theory.

What is the Fibonacci Golden Zone Indicator?

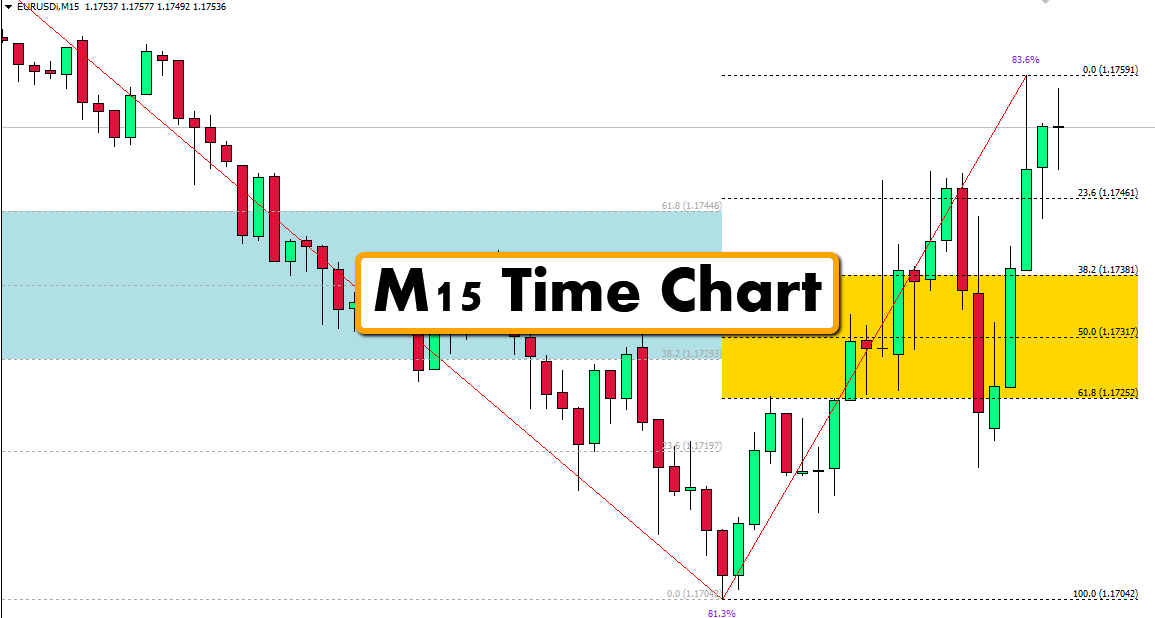
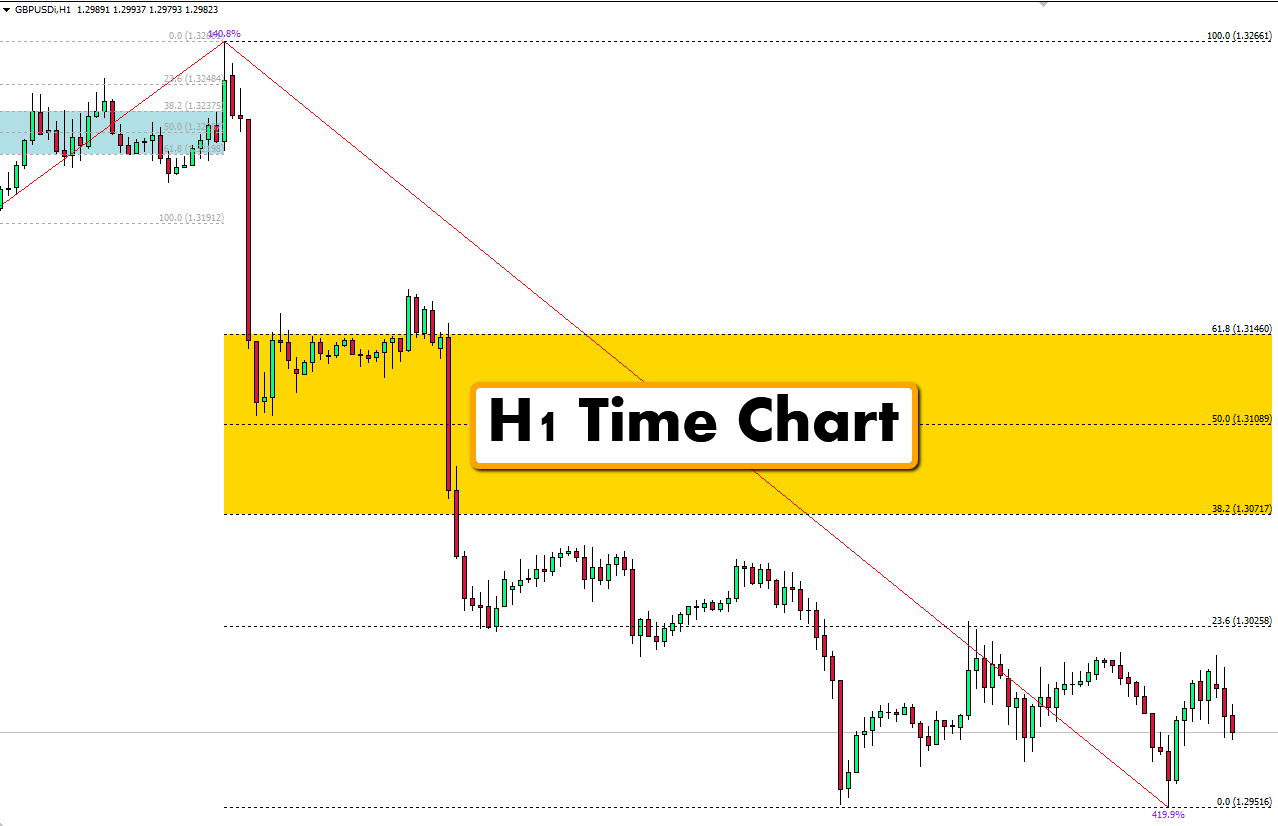
This custom indicator for the MT4 trading platform draws the key Fibonacci retracement ratios of 0.618, 0.5 and 0.382 on the chart when a swing high and low are identified.

It then highlights the zone between the 0.382 and 0.618 levels, known as the “golden zone”, where Fibonacci traders expect the highest probability price action to occur.

Overview of the Fibonacci Sequence and Ratios

The Fibonacci sequence is a series of numbers starting with 0 and 1 where each subsequent number is the sum of the prior two. This mathematical sequence produces an interesting ratio relationship where dividing certain numbers in the sequence by numbers further along produces ratios of approximately 0.618, 0.5 and 0.382.

These ratios are thought to have important applications in financial markets that tend to reverse or find support/resistance at these golden ratio levels.

Benefits of Using the Golden Zone Indicator

The Fibonacci Golden Zone indicator provides automated Fibonacci analysis on MT4 charts to help traders identify:

  • Key levels for possible support, resistance and reversals
  • High probability areas for entries and targets
  • Areas of order flow battles likely to produce volatility
  • Gauge overall market directional bias and strength

How the Indicator Works

The Fibonacci Golden Zone indicator applies the established Fib ratios to price action in real time:

Plots Fibonacci Retracement Levels

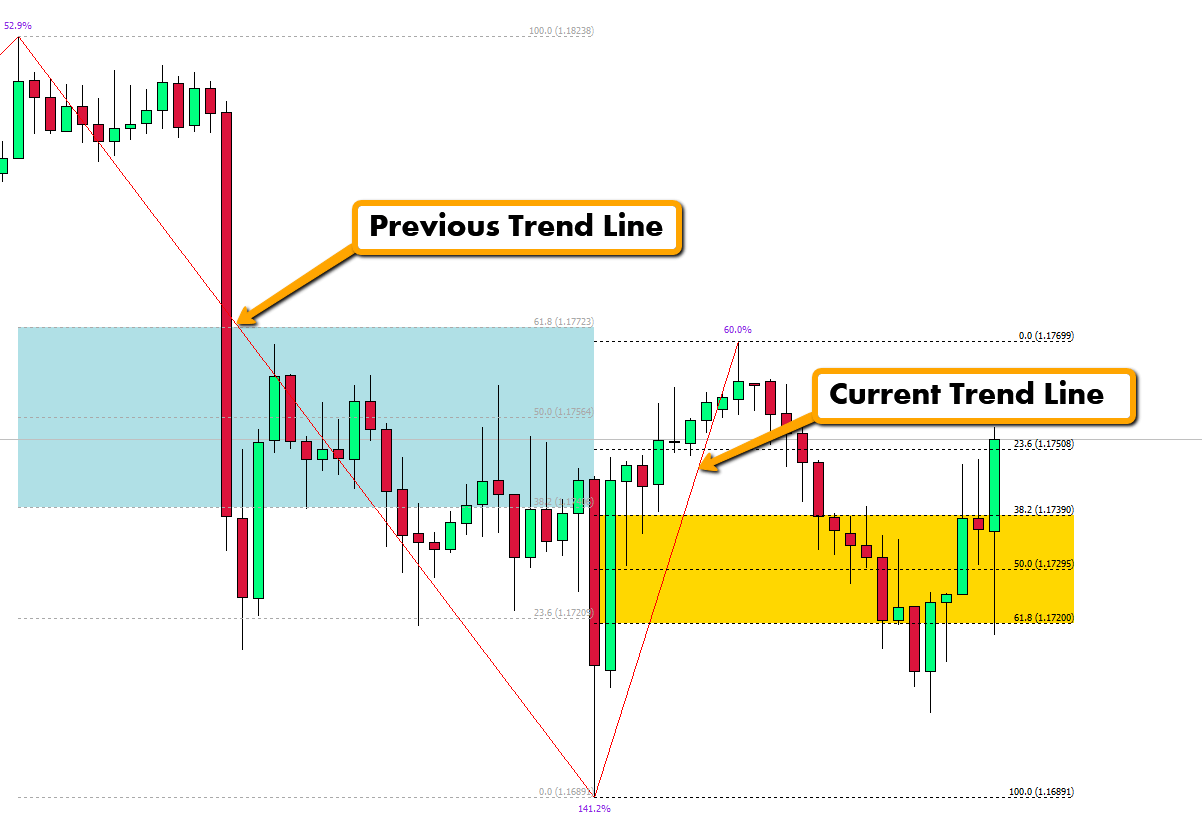
When a significant swing high and low form on the chart, the indicator plots the Fibonacci retracement lines connecting those points at the 0.382, 0.5 and 0.618 levels.

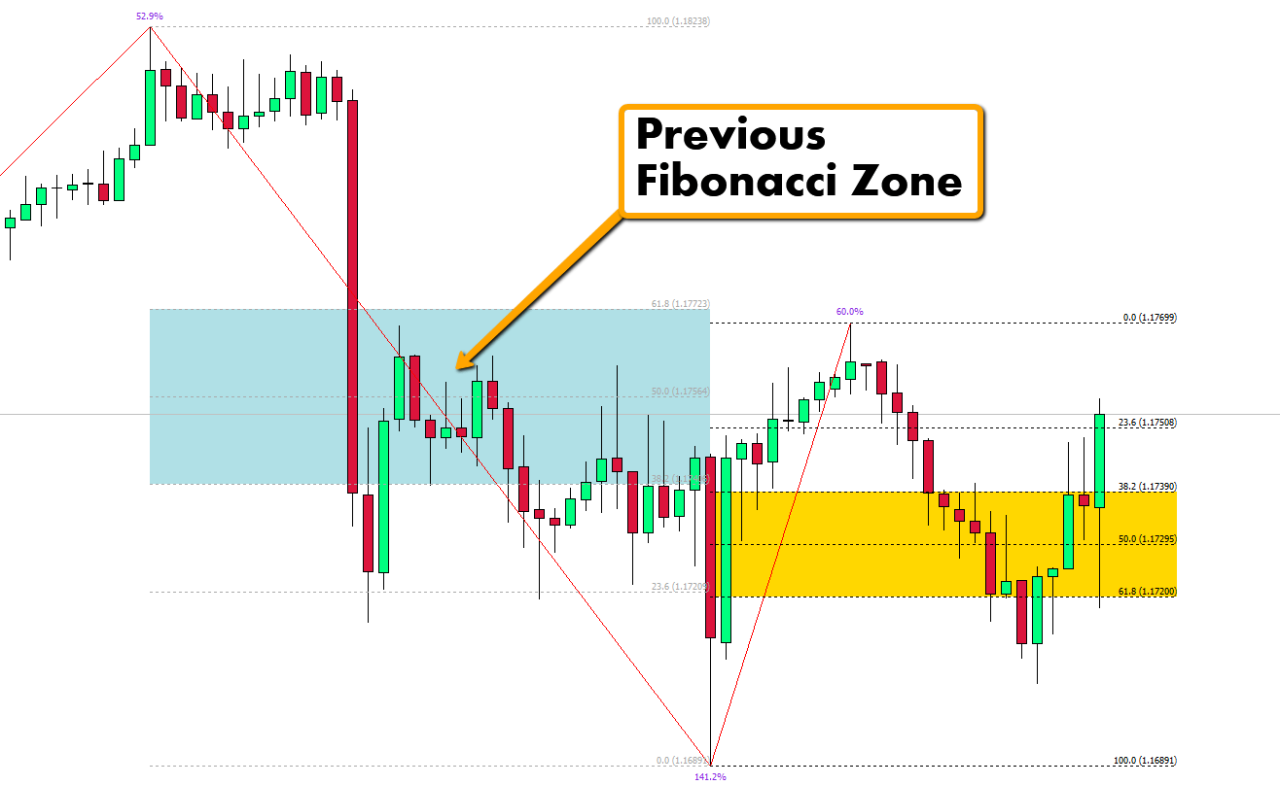
Highlights “Golden Zone” Areas

The levels between the 0.382 and 0.618 retracements are shaded in a color to clearly identify the “golden zone”. This is the area of highest expected volatility and reversals.

Visual and Alert Signals at Levels

As price interacts with the Fib levels, the indicator can flash on-chart colors and optionally trigger audio/email/push alerts to signal traders.

Customization Settings

Traders can tweak settings like the swing high/low sensitivity, zone shading color, and types of alerts delivered when price reaches key levels.

Trading Strategies with Golden Zone

The Fibonacci Golden Zone offers several possible trading applications:

Entries at Zone Support/Resistance

When price pulls back to the golden zone, traders can look to buy near zone support or sell at zone resistance with stops beyond the zone extremes.

Exits When Zones Break

If price penetrates through a golden zone that had been holding previously, it signals potential exhaustion requiring an exit.

Combining with Other Indicators

Aligning golden zone tests with overbought/oversold oscillators or candles/patterns creates high probability setups.

Optimizing Zone Parameters

Modifying the swing sensitivity and bars back settings can optimize the indicator to fit different trading plans and timeframes.

Using Golden Zone for Analysis

Beyond trade entry signals, the indicator also provides broader analytical insight:

Identifying Key Swing Levels

The plotted Fib levels highlight historic price points that acted as support and resistance during trends and ranges.

Seeing Overall Market Structure

Visualizing golden zones across a chart provides perspective on where significant battles occurred and the directional bias.

Gauge Trend Strength with Pullbacks

Shallow pullbacks that stall and reverse near the golden zone indicate strong trends. Deep pullbacks suggest trend weakness.

Golden Zone in Elliot Wave Theory

Common golf zone alignments with Elliot impulse and corrective waves helps confirm wave counts.

Tips for Effective Usage

Some guidance for using the Fibonacci Golden Zone effectively includes:

Using on Higher Timeframes

Longer period charts like daily, 4H and 1H smooth noise and provide cleaner structure.

Focusing on Confluence Zones

Levels where multiple golden zone instances overlap suggest extra significance.

Understanding Market Context

Factor in whether markets are ranging or trending when assessing zone tests.

Managing Trades at Zone Levels

Consider partial profits or hedging at golden zones on existing trades rather than all-or-nothing exits.

Strengths and Limitations

Strengths

  • Objectively identifies areas of interest
  • Levels based on established ratios

Limitations

  • Lagging and reactive nature
  • Specific levels not precise predictors

Examples of Trades and Setups

Retracement Bounce Entries

After a retracement to the golden zone, a bullish candle close above the zone suggests a long entry. Stop loss goes below the zone.

Breakout Pullback Entries

When price breaks a golden zone but retraces back, traders can buy the pullback for swing trade entries with the recent breakout as stop level.

Exiting at Zone Breaches

Closing out positions when price penetrates and closes past golden zones provides proactive protection before bigger losses.

Stop Loss Placement

Golden zones clearly define risk points for trades. Stops can be placed conservatively beyond the zones.

Conclusion

The Fibonacci Golden Zone indicator offers automated identification of high probability Fibonacci support, resistance and reversal levels on MT4 charts. This provides a valuable input into overall technical analysis.

However, as with any indicator, blindly trading golden zone tests tends to underperform relative to combining zone signals with other confluence factors within the broader price action context. Practice and experience creates skill in interpreting the zones effectively.

When used with proper risk management as part of a structured approach, the Fibonacci Golden Zone indicator can enhance MT4 trading strategies. It remains one of the most popular Fibonacci tools among retail forex and stock index traders.

Key Takeaways

  • Automated Fibonacci indicator identifying golden zones
  • Looks for bounces off zone support/resistance
  • Signals when price breaches zone levels
  • Ideal for combining with candle, pattern strategies
  • Requires prudent entry/exit timing and risk management

FAQs

What is the ideal setting for the bars back parameter on the Golden Zone indicator?

Most effectively optimize over 200 bars for hourly/4-hour charts and 500 bars for daily charts. But traders should experiment with varying lookbacks to match their style.

When is it best to totally exit a trade based on a Fib level break?

It depends on momentum and technical context, but generally after two closes below a key support zone or two closes above a resistance zone signifies high likelihood of follow through.

Can you use Fib Golden Zone as a standalone system?

It is not advisable to use any indicator on its own. Combining golden zone tests with price action patterns, momentum oscillators, or volume improves probabilities significantly.

How many instances of a Fib zone are needed for it to be considered significant?

There is no definitive rule, but generally 3-4 overlapping golden zones closely together establishes the level as an important decision point and confirms Fib theory relevance.

Should Fib levels be updated after initial plotting or remain static?

Updating golden zones over time rather than leaving initial static levels provides greater adaptability as market conditions evolve. But don’t over-optimize.

Reviews

There are no reviews yet.

Be the first to review “Fibonacci Golden Zone MT4”

Your email address will not be published. Required fields are marked *