

Description
Highlights of the Asian Session: London open and New York open (Kill Zones)
Highlights: New York midnight open (midnight)
Highlights: New York 8:30 a.m. news time
Highlights the New York Stock Exchange (NYSE), which opens at 9:30 a.m.
Automatically adjusts to your time zone.
Uses New York time for all indicator times.
Local time converter
Displays your local (computer) time on each candle (via the hover window of the candle).
Displays New York time on each candle (via the hover window of the candle).
Kill Zones MT4 Indicator
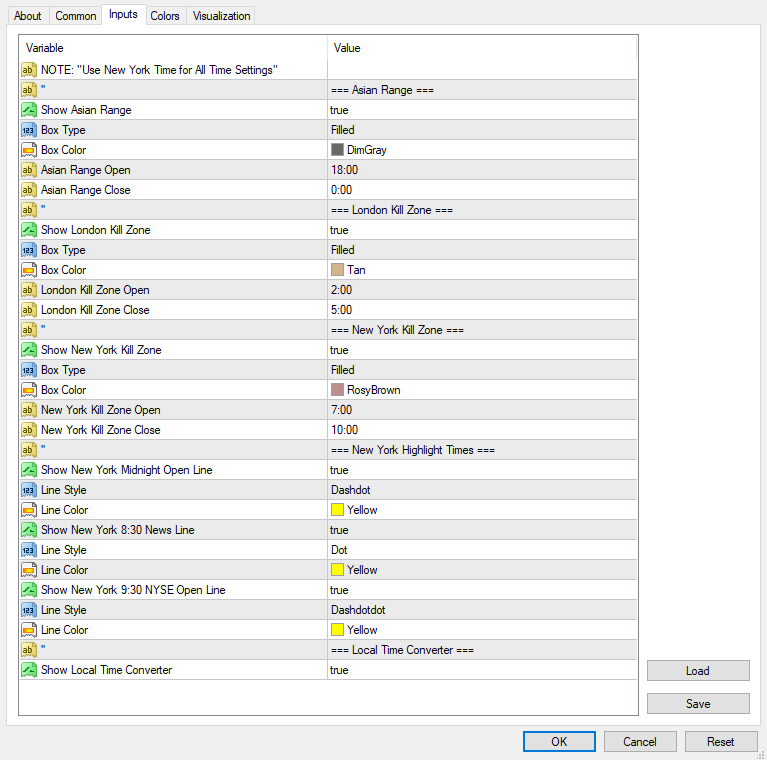
- ==== Asian Range ====
- Display Asian Range: Select the highlight of that Asian range box.
- Box Type: Choose a box outline or a box with a color-filled
- The color of the box: Choose the color you want to use.
- Asian Range Open Choose the Asian open time for the range (use New York time for all time settings).
- Asian Range End Choose the Asian range closing time.
- ==== London Kill Zone ====
- Display London Kill Zone: choose true or false to display London’s open box. London Open Box
- Box Type: Select a box outline or a colored box.
- Box Color: Choose the color you want to use.
- London Kill Zone is open. Choose your London opening time.
- London Zone Close: Kill Zone Close: Choose the London closing time.
- ==== New York Kill Zone ====
- Display the New York Kill Zone. Choose either true or false to display an open area in the New York open box.
- Box Type: Pick a box outline or a box with a color-filled
- Box Color: Choose the color you want to use.
- New York Kill Zone: Open Click New York Kill Zone is open. New York Open time
- New York Kill Zone Close Choose your New York closing time.
- ==== New York Highlight Times ====
- Display New York Midnight Open Line: Choose either the true or false option.
- Line Style: Choose what style you want to use for the line (solid dots, dots, etc.).
- Line Color: Choose the color you want to use.
- Display the New York 8:30 News Line. Select either true or false.
- Line Style: Choose what style you want to use for the line (solid or dot, etc.).
- Line Color: Select the color you want to use.
- Play New York 9:00 Open Line of NYSE. Choose either true or false.
- Line Style: Choose your line’s style (solid dots, dots, etc.).
- Line Color: Choose the color you want to use.
- ==== Local Time Converter ====
- Display a local time converter. Choose either false (to toggle the candle hover windows either off or on). Click your mouse on the top left corner of any candle (or the wick) to activate the ‘candle hover’ window to display your local time as well as New York time on that candle.
A quick refresher on the ICTKill” Zones:
What are kill zones?
Everyone who is an who is an ICT student is aware that certain times of the day can bring great trade opportunities. ICT designated these times as “Kill Zones”; they are found in those London as well as New York open sessions:
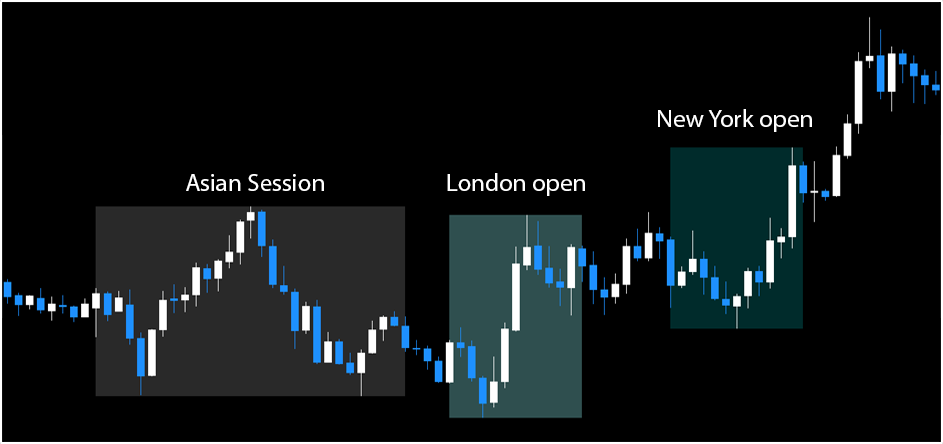
ICT has specified these session times:
- Asian Session 6 pm to midnight
- London Open 2 am to 5am
- New York Open 7 am to 10am
The session times are clearly displayed on the chart, which makes it easier to identify possible trade opportunities in these critical “kill zones.”
(Note Note that ALL times used to be used in the indicator’s calculations are NEW YORK time)
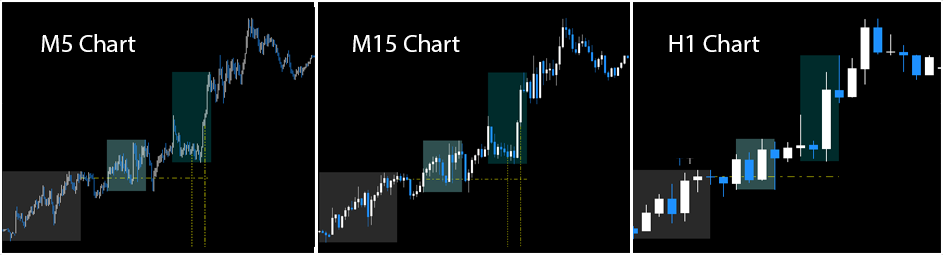
This indicator is intended to be seen in the chart of M15; however, it could be useful for charts like the M5, M30, or H1 charts:
What are we really looking for in these times?
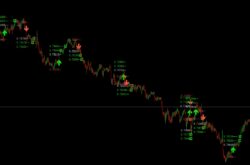
Most of the time, we’re looking for the smartest money to invest in “liquidity pools” that are at the previous swing points (usually during the previous session) to support their desired actions during the current day. For example, if you have an average daily trend for a particular instrument that is bullish (according to your analysis of the higher time frame), then you’d likely look for the bearish ‘stop hunt’ during that session. London opening session.
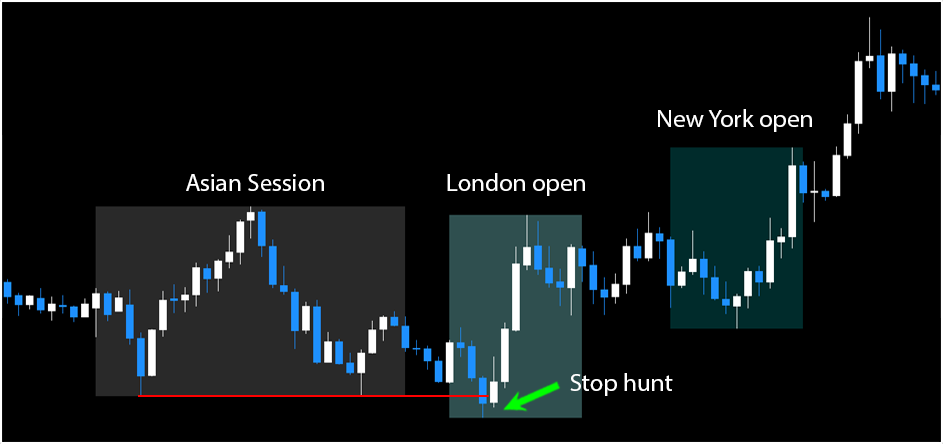
This is exactly what took place today. It is evident that prices made the same lows during the Asian session, and then was back to “snatch” the liquidity that was on the table (in in the shape of stop orders for bullish traders and bearish traders in the midst of “break out” orders) during early London open.
When this liquidity was taken, it was evident that “smart money” came into the market with massive bullish orders that drove the price quickly up…
After the huge market move that was bullish in early London, the price was able to consolidate for a short period. Let’s look at this chart once more to understand what took place within the New York ‘Kill Zone’:

Price was able to make similar lows during the time it had consolidated (engineered liquidity) and then during its final day, the New York open price came back, and again dragged the liquidity pool. Then, it was bullish for the remainder of the day.
If you take a closer look, you’ll notice that price created a series of ‘triple highs’ in both the Asian as well as London trading sessions (more than just engineered liquidity) which were followed by the New York session.
Note: These kinds of setups won’t happen every day. However, having these crucial “Kill Zones” highlighted on the M15 chart will enable you to identify these “perfect kinds of setups when they do occur.
Indicator Display Options:
Local Time Converter
The built-in local time converter will display your current (computer) timing on every candle. The indicator syncs with your computer’s clock to produce the local time converter’s ‘hover display’ (this helps you to compare your local time to both your broker’s time as well as New York time)
- To check your local time, hover your mouse over the top left corner of any candle (or the wick) to open the ‘candle hover’ feature to display the local time (and New York time) on the candle:
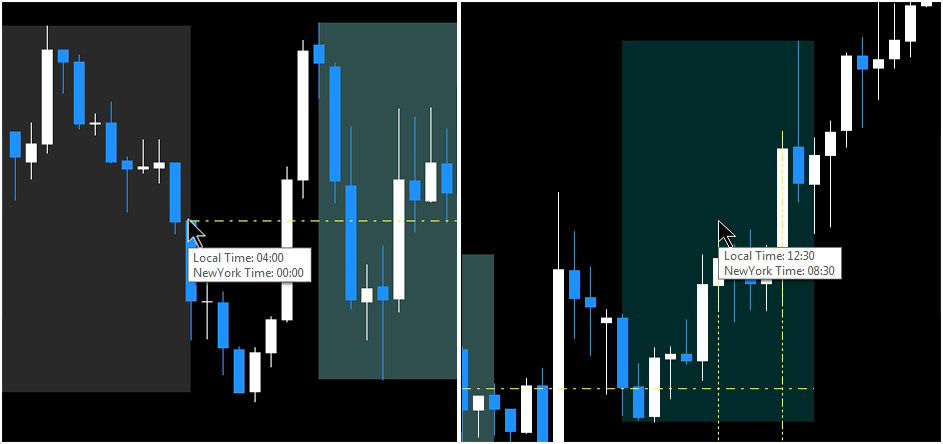
In the illustration above you can see the “floating window” of the local time converter ‘in action:
The image on the left shows your local time around the New York midnight candle
The image on the right shows your local time at 8:30 a.m. in New York
New York highlight times
The “Kill Zones indicator will draw perforated yellow lines along the chart of M15 to draw attention to:
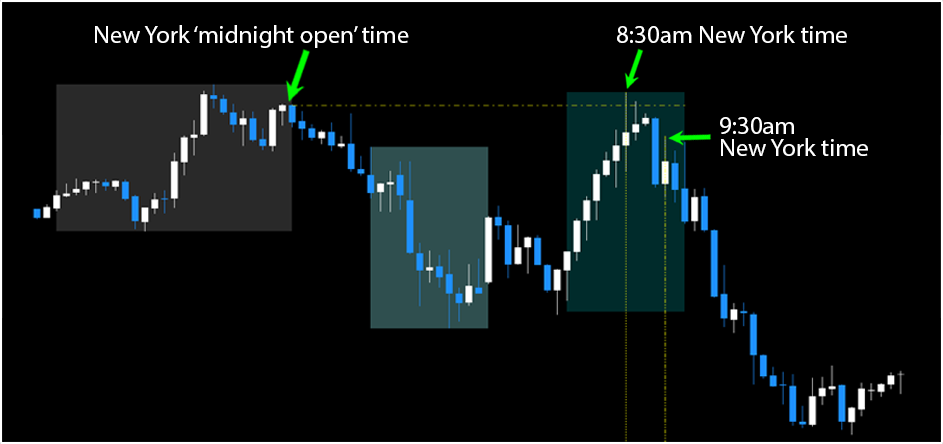
- New York Midnight Open time is a yellow line which is horizontally extends starting from midnight (12 am) in New York midnight (12 am) candle until the end of the New York Open session
- 8:15 am New York NEWS time – an orange line that runs downwards vertically starting from an upward direction from the New York 8:30 am candle (a very high-risk trade setup opportunity due to the important economic news that was released at the time)
- 9:15 am New York Stock Exchange (NYSE) open time A yellow line extends vertically down beginning at the New York 9:30 am candle (the NYSE open time that could trigger significant movements in US indexes based on the US)
The New York Midnight Open:
ICT has always surpassed the purpose of highlighting the New York ‘midnight open’ time on your charts.
Note: Trading configurations that rely on the New York ‘midnight open’ time are primarily USA that are based on Indexes and USD currencies.
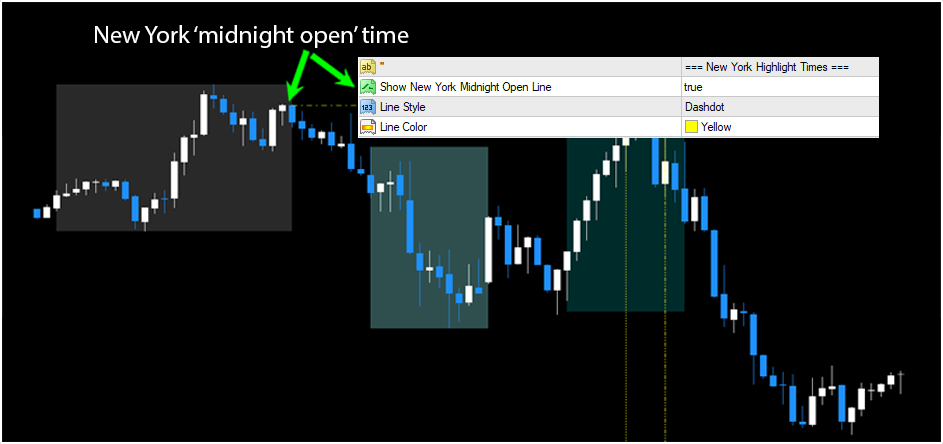
The “Kill Zones indicator will draw perforated yellow lines along the chart for M15 to emphasize:
- NY Midnight Open NY Midnight Open yellow line runs across the horizontal space starting from to NY midnight candle until the conclusion of the New York open session.
- 8:30 am NY time A yellow line that is vertically extending from the NY 8:30 am candle.
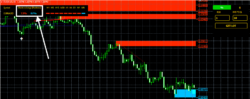
Bullish New York ‘Midnight Open’ trade setup (vice reverse in the case of bullish):
- Bearish Daily Expectation
- Markets rally over that of the NY Midnight Open price at 8.30 am (New York time)
- Price raises internal liquidity to the previous highs and then goes down a bearish path.
If you’re anticipating a bearish move this morning, prices will likely rise above the price that opened at midnight, 8.30 am New York time:
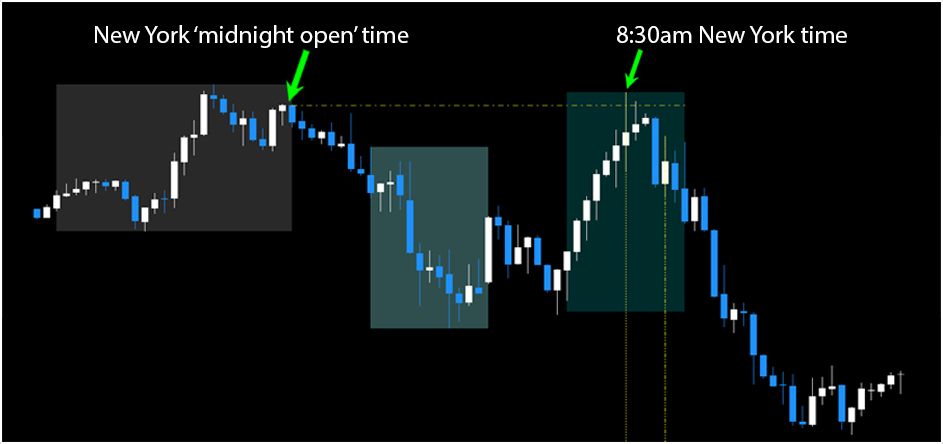
In the above picture, you can see how the price exceeded what is known as the New York ‘midnight open’ price (to draw internal liquidity) and then began to decline throughout the day.
Two things to keep in mind:
- These kinds of setups may not happen every day However, having these crucial “New York Times” highlighted on the M15 chart can help you in identifying these types of instances when they do occur.
- If this setup happens, it won’t always happen precisely around 8:30 am New York time (it can happen at any time during the New York open session)
- The highlight line at 9:30am is primarily used for USA -based Indices however, it will typically not impact currency pairs as much.