 ATRH INDICATOR Download
 Scalping with Parabolic SAR and Fibonacci
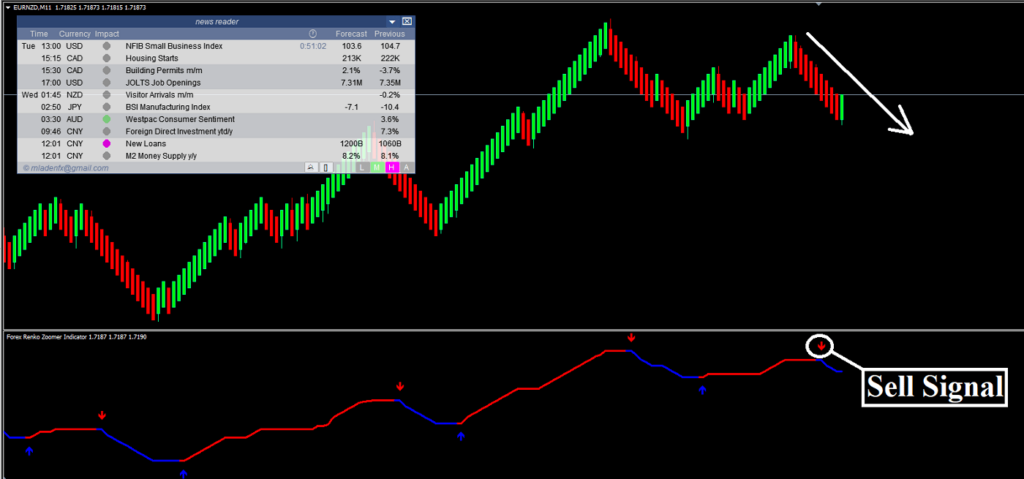
Scalping with Parabolic SAR and Fibonacci
Fibnacci Retracement
ForexStrategiesResources
Apply 2 Parabolic SAR to a 1 min EUR/USD chart.
1st ones settings = 0.02 & 0.2
2nd ones settings = 0.005 & 0.05
I only trade EUR/USD since I get a 1.5 pip spread at .
I only trade from 4amEST-6amEST.
I only trade in the direction of the 0.005 & 0.05 PSAR.
LONG
When price breaks
up through the 0.02 & 0.2 PSAR you
draw a Fibonacci retracement
from the closest last significant low (before pirce broke
PSAR)
to the high of the bar that broke the PSAR.
This gives you your PROFIT TARGET at 161.8% Level
and your ENTRY ar 50% level
STOP = Last Signifcant low -2 Pips
SHORT
When price breaks down through the 0.02 & 0.2 PSAR you draw a Fibonacci
retracement
from the closest last significant high (before pirce broke PSAR)
to the low of the bar that broke the PSAR.
This gives you your PROFIT TARGET at 161.8% Level
and your ENTRY ar 50% level
STOP = Last Signifcant high +2 Pips
SIMPLE MM VARIATION.
LONG
When price breaks up through the 0.02 & 0.2 PSAR you draw a Fibonacci
retracement
from the last significant low (before pirce broke PSAR)
to the high of the bar that broke the PSAR.
This gives you your ENTRY @ 50%.
PROFIT TARGET = +9 Pips
STOP = -8 Pips
SHORT
When price breaks down through the 0.02 & 0.2 PSAR you draw a Fibonacci
retracement
from the last significant high (before pirce broke PSAR)
to the low of the bar that broke the PSAR.
This gives you your ENTRY @ 50%.
PROFIT TARGET = +9 Pips
STOP = -8 Pips
Share your opinion, can help everyone to understand the forex strategy.
- Platform: Metatrader4
- Currency pairs: Any pairs, indices and metals
- Trading Time: Around the clock
- Recommended broker: icmarkets, XM
- How to install MT4 indicator?
- 1. On the desktop, double-click to open the MT4 trading platform software you installed.
- 2. Click on “File” – “Open Data Folder” in the upper left corner, double-click the MQL4 folder, and double-click the Indicators folder
- 3. Copy the metrics you need to install to the Indicators folder
- 4. Open MT4, find “Navigator” in the display menu, then click “Technical Indicators” of “Navigator” and right click to refresh, you will see the indicator just copied.
- 5. In the “Technical Indicators” of “Navigator”, find the indicator file just installed, double click or click manually to the chart window

Responses