Candle Patterns Indicator
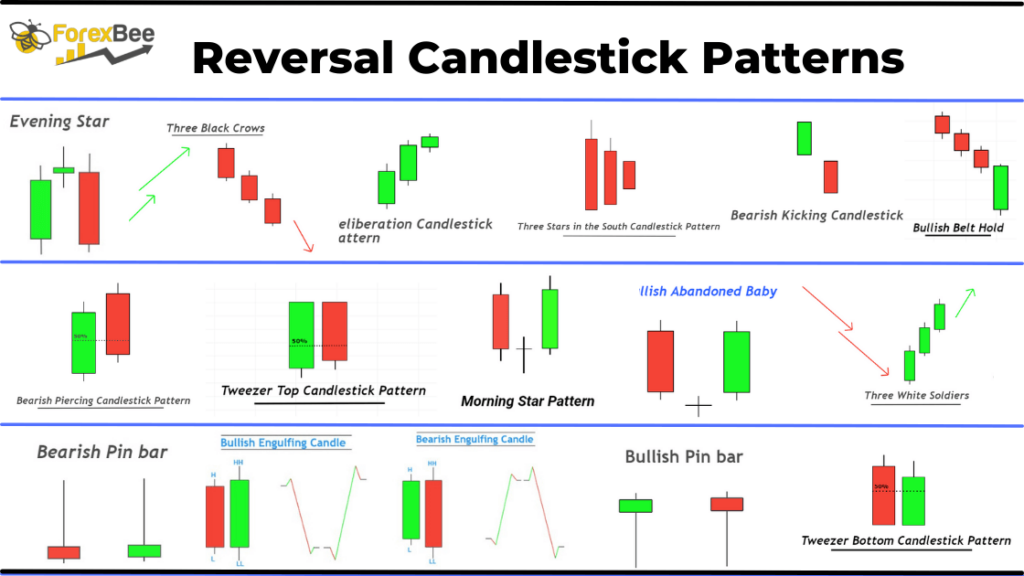
Price action traders like candle pattern indicators. There are many candle patterns in the Forex market. These patterns can be classified as bullish and bearish. Candle patterns usually consist of one or two candles.
These patterns can indicate trend reversals, continuation or changes, depending on where they are in the market. Candlestick formation is a key skill that traders can use to predict the direction of the market.
If you have been studying them for a while, you can easily identify these patterns. It can be difficult trying to find candle patterns from one bar to the next. The Candle Patterns indicator can be downloaded for free.

The indicator allows traders to take advantage of trading opportunities. If there is a chance of a reversal, breakout, or other potential event, you can adjust your position. The Candlestick Pattern Indicator can also be used in any time frame and currency pair.
How the Candlestick Pattern Indicator works
The Candlestick Pattern Indicator is easy to use. Install the indicator on your price chart and it will take care of the rest. You can choose the pattern you want and adjust the notification settings. After you have set your preferred settings, the indicator will scan the chart to identify the most popular candle patterns.
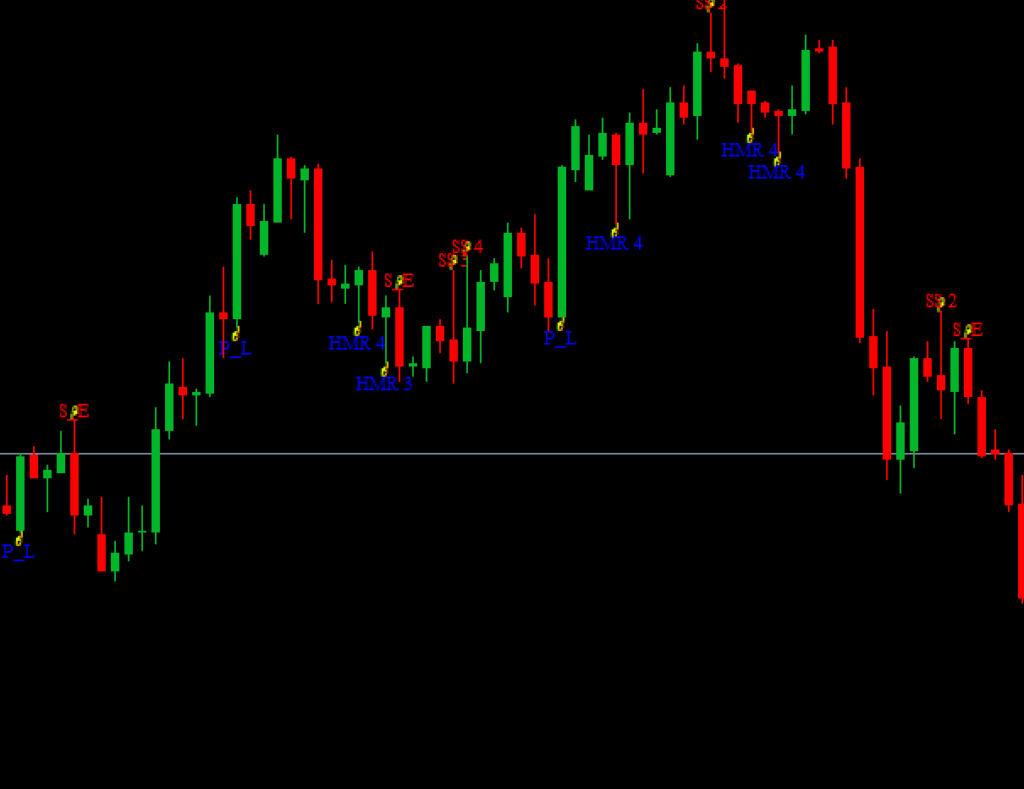
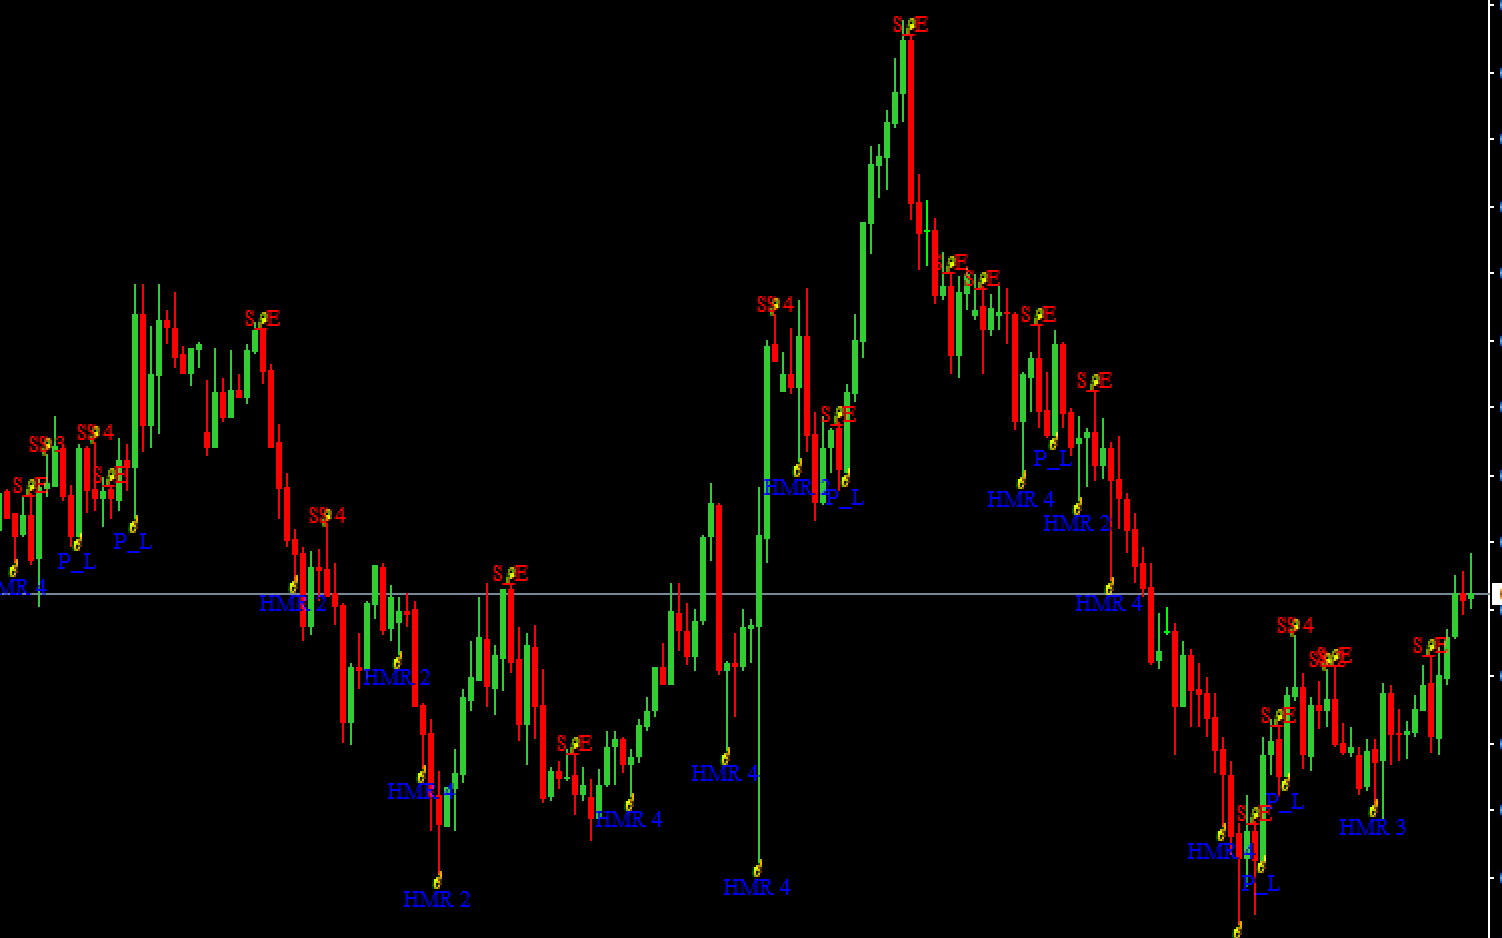
The arrow placed at the top of the candlestick marks a bearish candle design. On the other hand, the arrow placed at the bottom of the candlestick indicates that the candlestick is bullish.
It is easy to recognize the name of a candlestick chart. The indicator is helpful in three important ways. It helps you to establish entry signals, exit signals and trailing stops.

Not every candlestick is eligible to enter a trade. You should only trade bullish candlesticks in an uptrend. In a downtrend, a bearish candlestick will suffice. You should also consider candle patterns that appear in support and resistance zones.
The candle pattern indicator scans the price chart and identifies the candle pattern. For example, the green arrow indicates a shooting star. A shooting star is either a resistance level or a new peak. This signal can be used to indicate a potential reversal.
You will also notice the doji marked by the red arrow, which formed at a support level. After a while, the price starts to rise. This circle also points to a hammer pattern. The pattern is located in a resistance zone, which indicates a possible market reversal. The price fell again after several tests of the resistance level.
Conclusion
Technical analysts interested in price behavior strategies can use candle patterns as a powerful tool. You don’t need to look at a chart to find candle patterns. The chart pattern indicator can name and identify all popular candle patterns and improve your trading results. Candlestick patterns can be used to analyze technical trends.
[signinlocker]
[/signinlocker]


Responses