price channel indicator mt4

In contrast to indicators such as Bollinger Bands and Average True Range, this indicator is based on the difference between the lowest low and the highest high. This means that it is related to possible resistance or support zones. Price channels, like Bollinger Bands and Average True Range, tend to narrow when prices are consolidating, usually before a breakout.
Finally, this indicator can be used for two purposes.
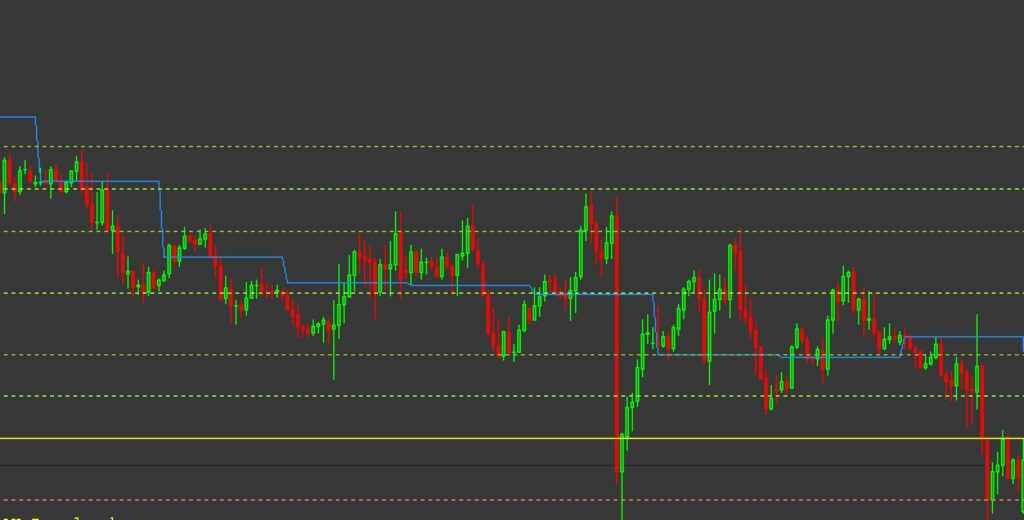
To identify possible resistance and support levels for channel trading techniques
To observe price breakouts when prices are above or below the upper or lower rails of the price channel.
How to use this indicator?
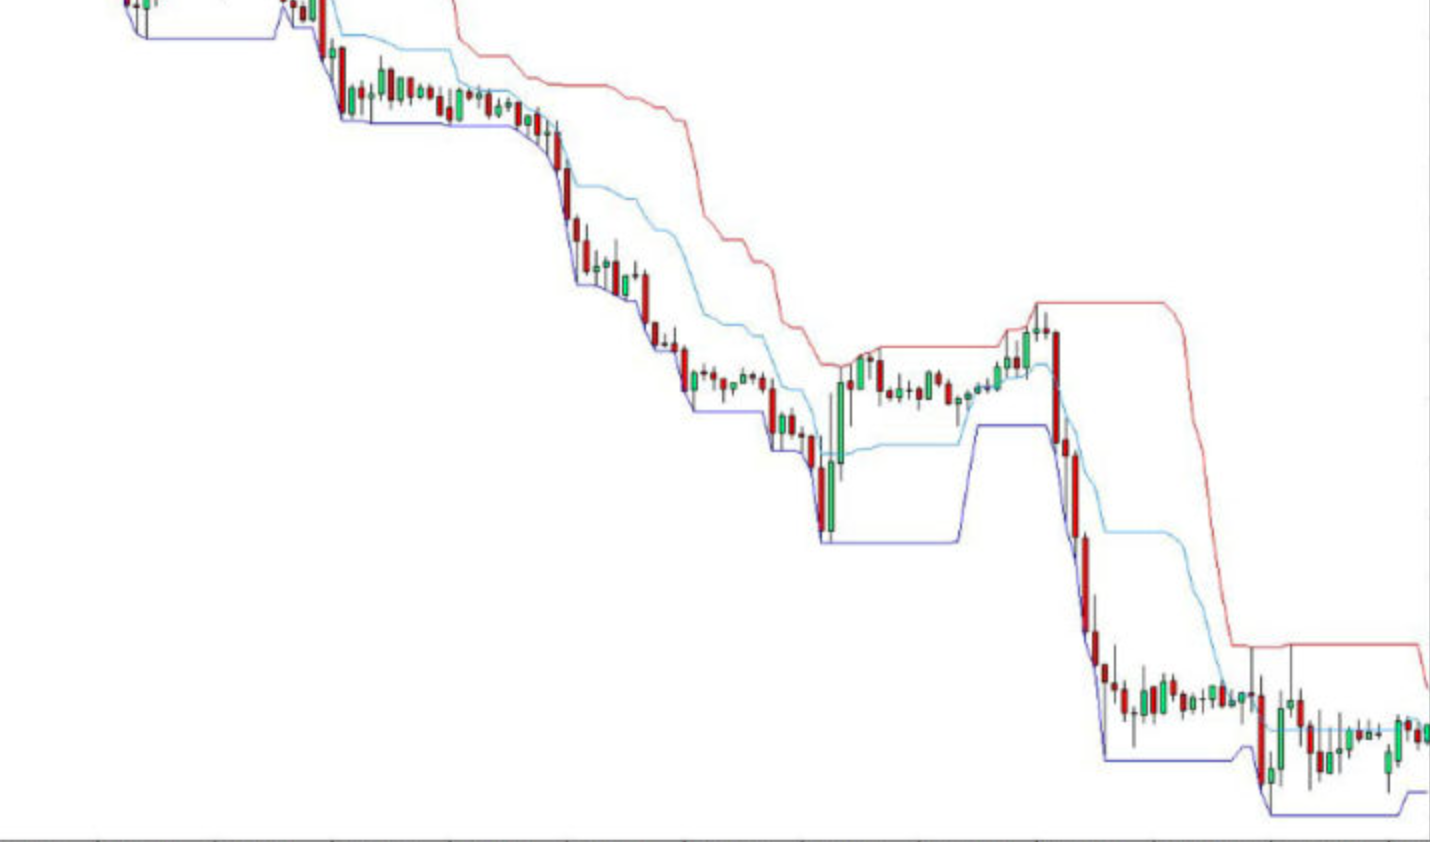
When the price pivot rises, then the lower trend line of the indicator is drawn. When the price pivot is lower, the drawn trend line rises. The degree of decline and inclination determines the direction of the trend. An ascending price channel can be defined as a trendline with a positive slope, which indicates that it is trending upward.
Conversely, a falling or declining price channel is characterized by a trend line with a negative slope, which indicates that prices may move lower with each price movement.
The two lines on a price channel symbolize resistance and support. Resistance and support lines can be used to create signals that can be used for successful trading.
Price Channel Indicator Trading Strategies
There are many ways to benefit from this indicator. A currency pair has the best chance to profit when it follows a well-defined price channel.
Indicator Buy Setup
The price should be above the upper part of the channel.
Watch until the candle confirming your confirmation lights up
Make sure to enter on the confirmed candle
Set a stop close to the recent low
Exit when the price falls below the upper channel.
Indicators for sell setups
Price should be able to close right below the downside channel.
Watch until the confirmation candle lights up
Make sure to enter on the confirmation candle
Set a stop close to the most recent high
Exit when price exceeds the downside channel
Bottom Line
This indicator allows you to profit from price fluctuations between resistance and support lines. It can also help to find breakouts.
It is recommended to pair this indicator with other indicators to confirm the trend.
[signinlocker]Price_Channel.zip[/signinlocker]


Responses