

Description
This Auto Elliott Waves indicator is an indicator for MT4 which automatically plots Elliott Waves on the chart. This sophisticated tool, which is packed with a wide range of features and allows for a high degree of customization incorporates the Elliott Waves Theory to create a seamless trading environment.
The Fully Automated Waves, and the semi-automated waves are the two major features in the Auto Elliott Waves indicator.
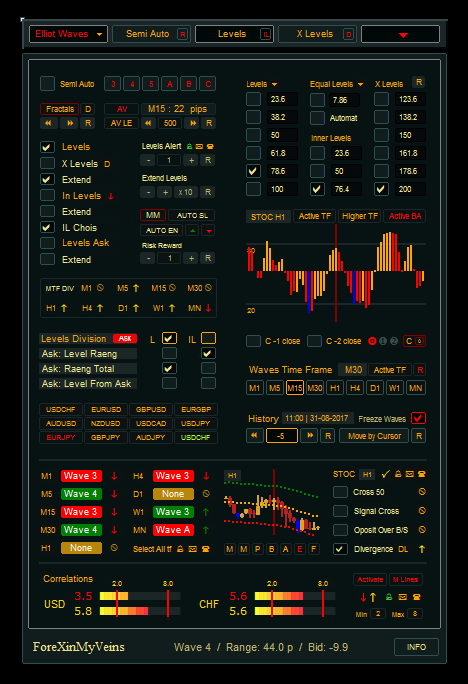
The software will place waves on the chart in the fully automated mode based on fractals for the timeframe selected. The software eliminates the need to manually apply and identify the waves. This allows traders to focus on their strategy rather than technical analysis.
The semi-automatic option allows traders to place waves manually anywhere on the chart, while still adhering to the fundamental wave principles. You are guided through the wave placement process, which ensures a balance between control and convenience.
The Elliott Waves Indicator for MT4 is compatible with all Forex currency pairs and other assets, such as commodities, Cryptos (Cryptocurrencies), Binary Options, Stock markets, Indices etc. It can be used on any timeframe that you prefer, from the 1-minute charts to the Monthly charts.
What are Elliott Waves?
Elliott Wave Theory is an example of technical analysis used by traders to forecast market trends and analyze financial market cycles. This technique identifies extremes in investor psychological states, price highs and prices lows, and many other factors. Ralph Nelson Elliott created it in the 1930s. His theory states that markets move through repeated cycles. He attributed this to investors’ ever-changing moods, influenced by external factors.
Elliott suggested that market cycles are the result of investors’ reactions to external influences or the dominant psychology at the time. He discovered that the upward and downward swings of mass psychology always appeared in the same patterns. These patterns were further divided into what he called “waves”.
According to the Elliott Wave Principle, markets have patterns. These patterns are directly related to trader psychology: optimism and pessimism. The theory distinguishes between two types of waves – impulse waves and corrective wave.
- Waves In Elliott Wave Theory, the impulse wave is composed of five smaller waves that move in the direction of the larger trend. They are a crucial part of the overall pattern. The ‘net’ movement is in the direction of the larger trend.
- Corrective WAVES: On the other hand corrective waves are made up of three smaller waves that move in the opposite direction of the larger wave. These waves show the times when the trend in the market ‘corrects itself’.
The combined impulse and corrective wave forms a complete eight-wave cycle. The theory also states that the eight-wave cycle is part of a larger pattern. Understanding where the market is in this cycle can help traders predict future price movement.
While the Elliott Wave Theory can be used to provide a general roadmap of where a particular market may be headed, it is not considered a tool for precise timing. It’s still widely used by analysts and traders to plan trading strategies and conduct market analysis.
What is it and how does it work in Forex Trading
Elliott Wave Theory (EWT) is a tool that forex traders often use to analyze the market and plan their strategy. Its focus on wave cycles helps predict price movement, by identifying extremes in investor psychological patterns and price highs or lows. This is how it’s used in forex trading.
- Identifying Trends and Market Cycles The first step in determining whether the market trend is up or down is to identify if it is moving sideways. You can do this by looking at larger timeframe charts, such as those for the daily, weekly or monthly periods. Elliott Wave Theory says that markets move according to a 5-3-wave pattern. The 5-wave pattern represents a trend, while the 3-wave pattern represents a countertrend or consolidation period.
- Predicting Future Price Movements Traders can forecast future price movements by identifying wave pattern. If a trader determines that a market has finished a 5-wave pattern of impulse, then they can predict the next pattern will be a 3-wave pattern. A trader can expect a 5-wave impulse pattern if the market has completed a 3-wave correction pattern.
- Determining Exit and Entry Points Elliott Waves also can identify possible entry and exit points. If a trader sees a 5-wave chart pattern nearing completion, then they may open a new position in order to capture the counter-trending 3-wave chart pattern. A trader might decide to take profits or exit after a five-wave pattern, anticipating the reversal of a countertrend.
- Risk management: This theory is used in risk-management. If a trader expects a 3-wave corrective wave, but price breaks beyond the beginning of the previous impulse wave, which is not what the theory predicts, they will know that their analysis was wrong and should exit the trade.
While Elliott Wave Theory is a powerful tool it can also be complex and open to interpretation. Like all trading strategies it does not guarantee outcomes. It should be used in conjunction with other technical analysis tools and fundamental analysis.
Elliott Waves Indicator: Customize the Dashboard and Inputs
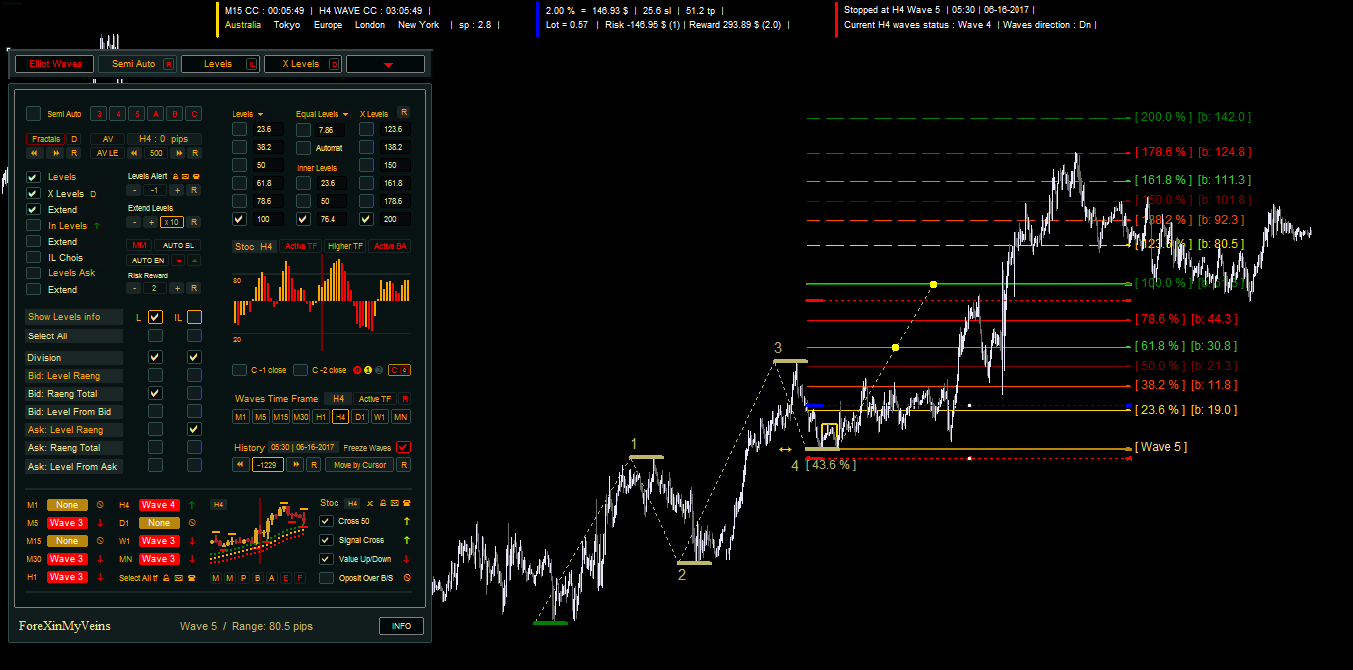
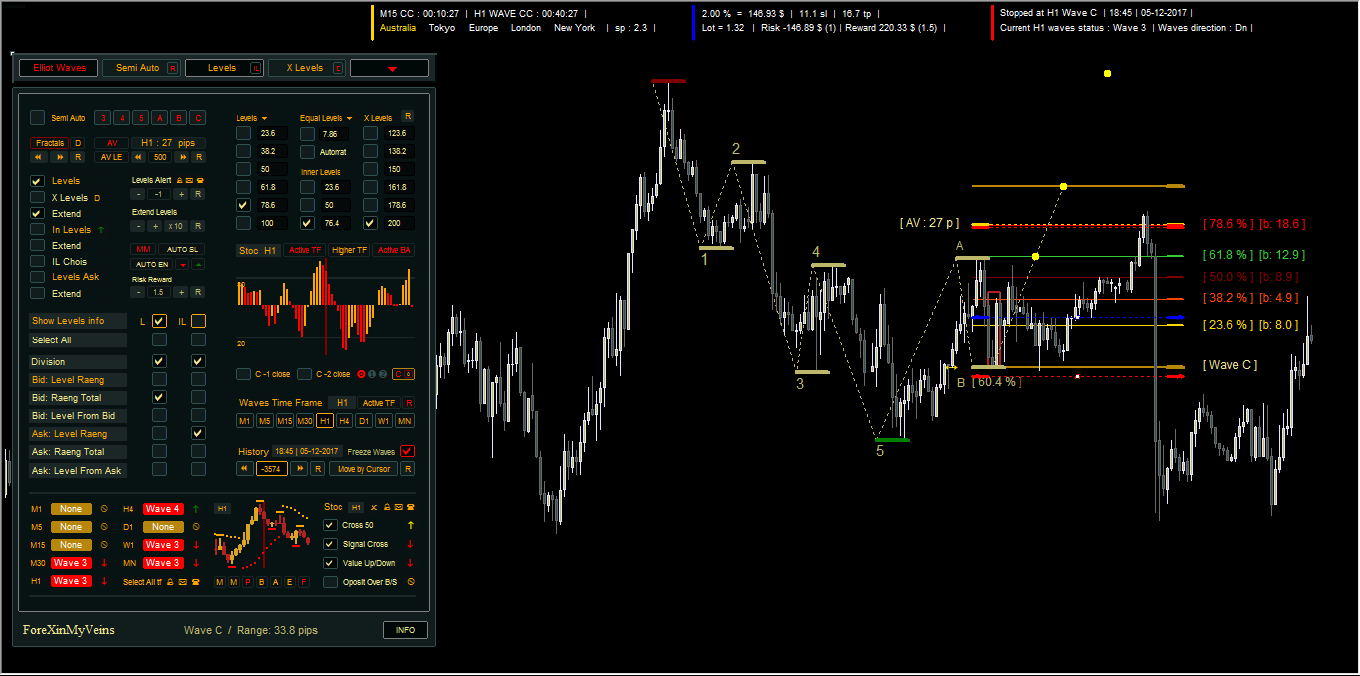
The Elliott Waves Indicator’s superior customizability is a standout feature. Over 100 input parameters are adjustable, allowing traders the ability to tailor their trading strategies and risk profiles. Included are oscillators and money management settings. Wave placement is also included.
Elliott Waves Indicator also features a customizable, yet comprehensive dashboard that provides a rich source of information and is easy to navigate. The dashboard can be customized by the user. They can choose what data they want to see and create personalized alerts. This allows for a tailored trading environment that optimizes trading efficiency and profitability.
Auto Elliott Waves Indictor: Features
The Auto Elliott Waves is a unique vehicle with many novel features.
- Automatic money management: The software manages investments using an automated risk-reward rate, thus promoting disciplined and risk adjusted trading.
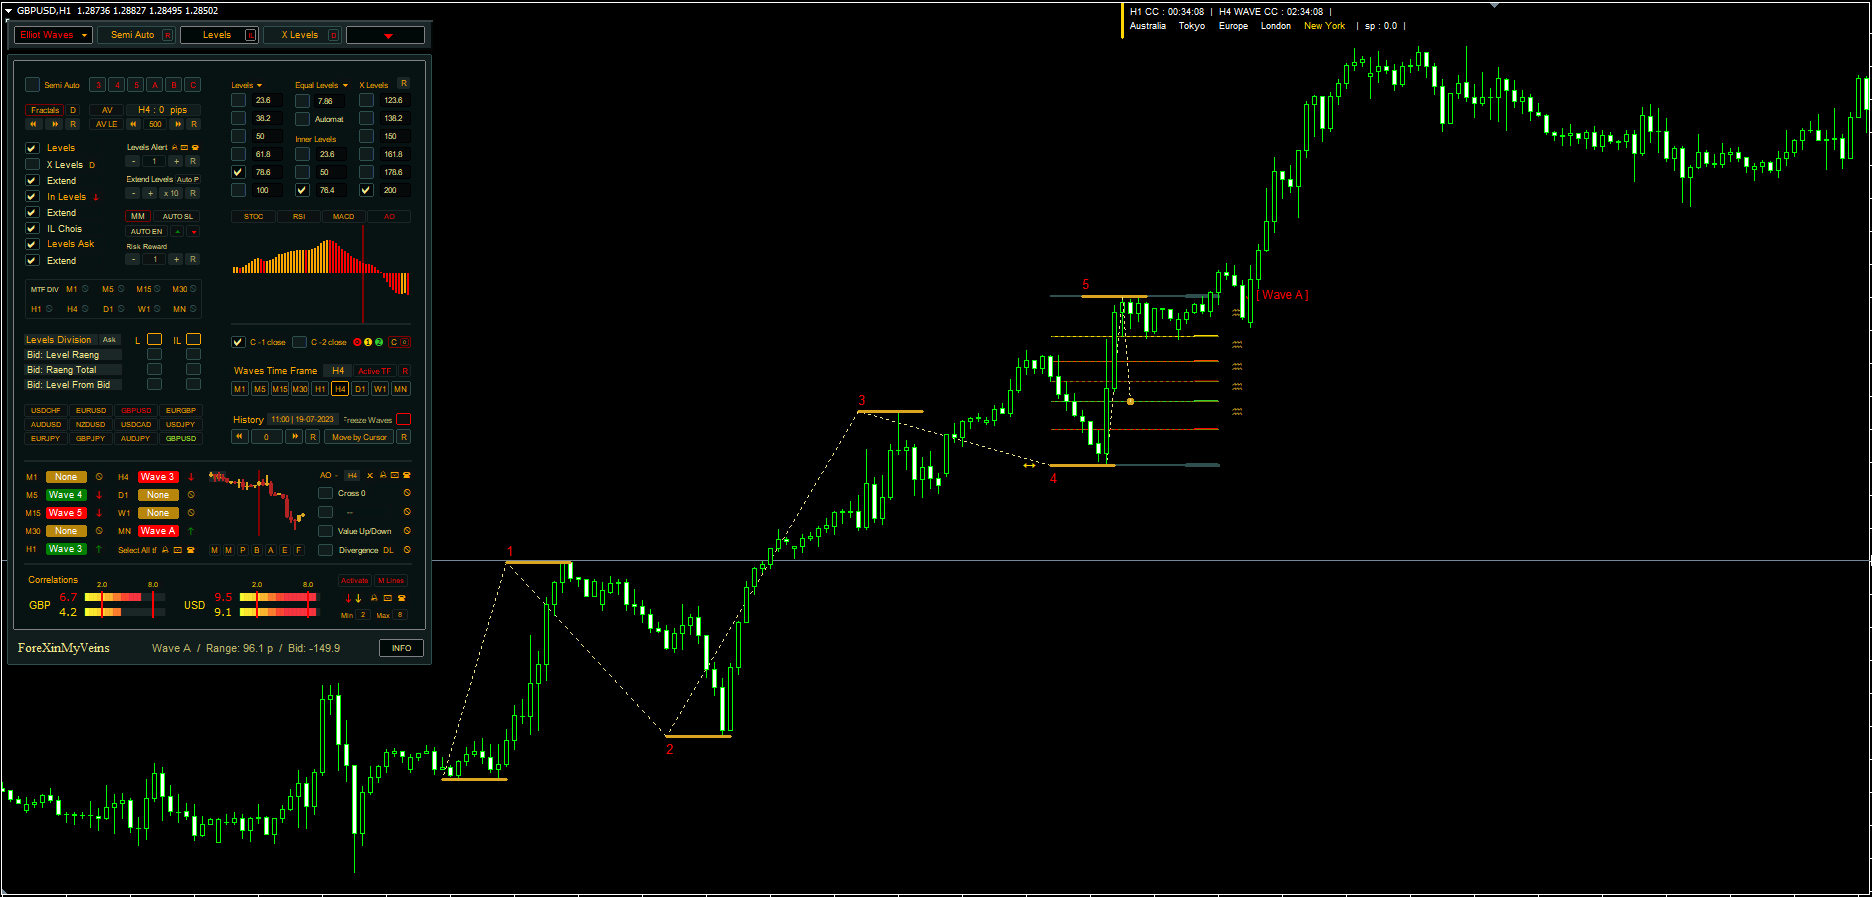
- Wave Display with Multi-Currency and Multi-Timeframe: This display has an alarm system for multi-currency and multi-timeframe. The panel allows traders to easily change the chart timeframe and currency.
- Comprehensive Mini-Charts: Elliott Waves Indicator offers mini charts that include Candles, Moving averages, Fractals (MAs), Average True Range (ATR), Bollinger Bands (PSAR), Envelopes (PSAR), Parabolic Stop and reverse (PSAR), Average True Range (ATR), and Bollinger Bands (PSAR), offering a comprehensive trading view.
- Divergence-Oscillators: With options from four oscillators – Stochastic, RSI, MACD, or AO, the software provides multi-time frame divergence and signaling.
- Automatic correlations strength: This newly-added feature helps in measuring the correlations between different trading pairs.
- Trading levels and Fibonacci level: Auto Elliott waves allows division of trading levels into pips or regular division and percentages. It also creates Fibonacci levels.
- Average price movement:This innovative feature calculates average price movements between fractal lows and highs up to 1000 candlesticks back in the timeframe of the wave, allowing for accurate price prediction.
- Trading Levels Internal: It provides levels internal for each of the main trading levels.