Action Trade Trading System

Action Trade Trading System
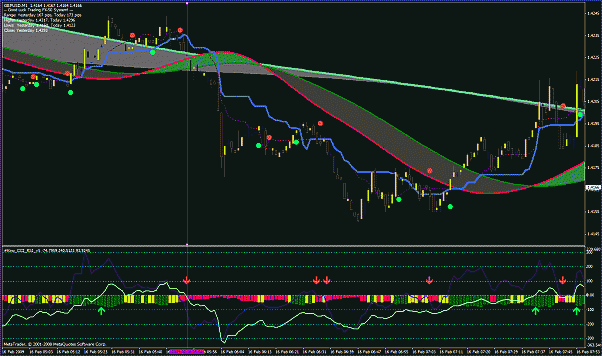
DoubleCCI Scalping
ForexStrategiesResources This is a DoubleCCI Scalping System. This Trading System is only for ECN Brokers Accounts. Pairs:Major Time frame: 1M. Spread max:0,00015. Price: Bar Chart.
Indicators:
- Kino T3 Ma Ribbon filled;
- Kijun Tekan (default);
- RD Pivot Line;
- Je-Bar;
- Ma Candles;
- Zig Zag Pointer;
- Spud Fibo;
- Fx Prime V Final;
- Kino close under ribbon;
- DoubleCCI With Sma.
Long Entry Position: Kino Close under ribbon, DoubleCCI With SMA and FXPrime is green. Short entry position:Kino Close under ribbon, DoubleCCI With SMA and FXPrime is red. No Trade Zone: Kino close under ribbon is yellow. Profit exit: price toches SpudfFibo level, price crosses Kino T3 Ma Ribbon filled (27, 36) Stop Loss: 8-10 pips and move to breakeven.
ActionTrade V.3.12
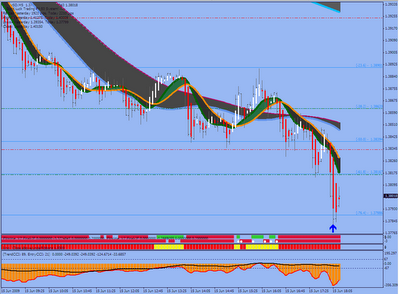
Zone Characteristics: 1. When price rises from or falls out of all three zones at the same time (especially when they are very narrow and close together) it’s going to be a high probability trade. Price goes into black area. These are by far the best trade setups….. for the simple reason that there is no price rejection by one of the other ribbons !!!! Look at example in chart 1. 2. When price rises from TF1 ribbon and TF1 ribbon starts rising above TF5 and TF15 ribbons (Strong Uptrend), it’s very likely that this breakout to the upside will present more than one trade.
Most of the time two or three trades are possible here. The same goes for the opposite direction when price falls out of TF1 ribbon and TF1 ribbon falls under both TF5 and TF15 ribbon (Strong Downtrend)….. now check #Kino_CCI_RSI_v5 and look for more than 1 Short trade in a row. 3. When price goes from one zone (say TF1) towards another (say TF5) look for support or resistance on the edges. Look at Chart 2. Usually a zone can be entered by price when a zone is widening and price will be rejected when a zone is narrowing. When a Zone is very narrow resistance/ support will usually be high, though price crosses with ease right at the center crossing of a ribbon (i.e at crossing of ribbon lines of that specific TF ribbon. Most of the time this will be the case with TF1 Ribbon when this happens). 4. Trading in the space between Ribbon Zones (i.e. in black area) usually too presents good trade setup possibilities when price is not (immediately) going to be rejected by a nearby Ribbon or a pivot, etc. The wider the black space between the zones the better the chances for a good trade setup….. yet always verify any trade at the same time with #Kino_CCI_RSI_v5 and strength of divergency. 5. Trading inside a wide opened zone (say TF15) is also possible, For instance when trading GBPJPY you will notice this zone quite often to be very wide. Now when TF1 ribbon has entered Share your opinion, can help everyone to understand the forex strategy.
- Platform: Metatrader4
- Currency pairs: Any pairs, indices and metals
- Trading Time: Around the clock
- Recommended broker: icmarkets, XM
- How to install MT4 indicator?
- 1. On the desktop, double-click to open the MT4 trading platform software you installed.
- 2. Click on “File” – “Open Data Folder” in the upper left corner, double-click the MQL4 folder, and double-click the Indicators folder
- 3. Copy the metrics you need to install to the Indicators folder
- 4. Open MT4, find “Navigator” in the display menu, then click “Technical Indicators” of “Navigator” and right click to refresh, you will see the indicator just copied.
- 5. In the “Technical Indicators” of “Navigator”, find the indicator file just installed, double click or click manually to the chart window
Responses