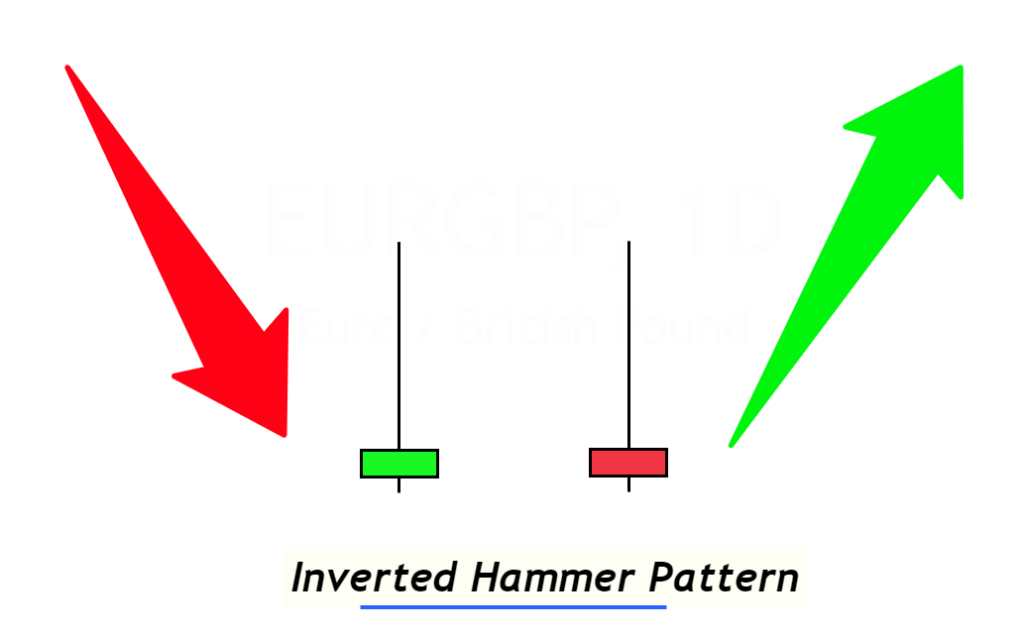
Bullish Inverted Hammer Candlestick Pattern
A bullish trend reverser pattern, an inverted hammer candlestick consists of just one candlestick that has a large upper shadow and a smaller body at the base. An inverted hammer candlestick has a long shadow that forms mainly in the same range as the preceding candlestick.
Inverted hammer candlesticks are used by retail traders to predict market trends. Inverted hammers signify the accumulation of market buy orders. The market will become bullish if buyers enter it.
In this article, you’ll learn the structure, significance, trading psychology, and trading signal of the inverted hammer patterns.
[wptb id=16694]
How do I find an inverted Hammer candlestick?
A retail trader must always include confluences when looking for patterns in the price charts. This will help to identify high probability patterns. Because the market chart is full of noise, it won’t be easy to trade all the candlestick patterns profitably. That’s why we have added a few rules to identify good patterns:
- Structure
- Trends in the past
- Lage
These parameters will increase the precision of the inverted-hammer candlestick patterns.
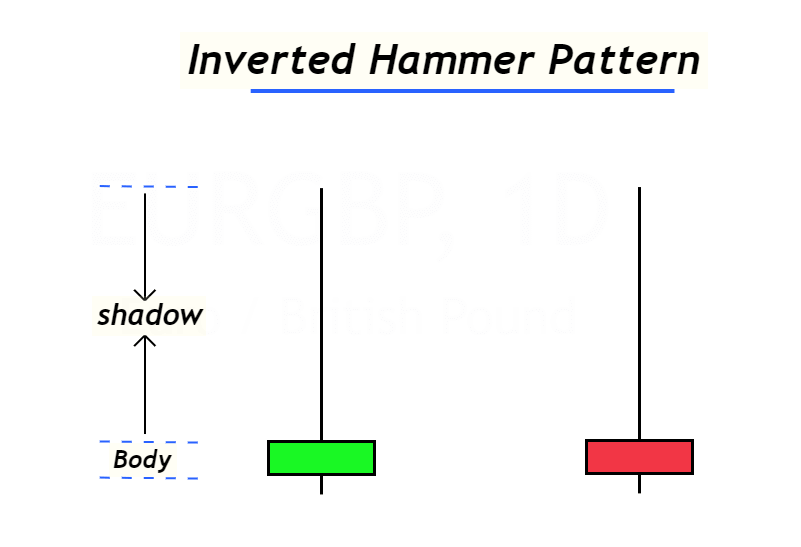
Structure
The structure includes the size of wicks/shadows and the candlestick’s body: a long upper shadow and a small body at the bottom in an inverted hammer pattern. The body and shadow make up 80% and 20% respectively of the total candlestick.
Inverted Hammer Candlestick Pattern was a popular trend in the past
It must bearish before it forms the inverted-hammer pattern. It will lose its chances of winning if it follows a bullish trend.
Good practice is to make three to four bearish candlesticks.
Lage
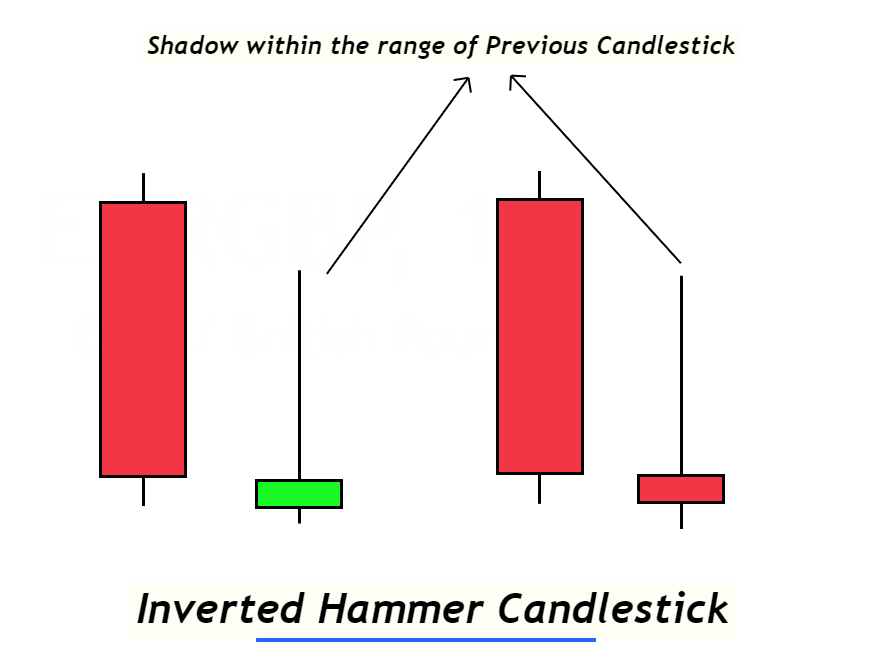
It should not be formed within the range candlesticks, or during sideways movements in the market because the perception of the pattern changes as a result of changing location.
If an inverted hammer forms after the bullish trends, it acts as a bearish trend reverser instead of the bullish. This is because it is similar the bearish pinbar.
That’s why the perfect location is the formation of an inverted hammer after the downtrend, and the big shadows must be within the range of the previous candlestick. For a more detailed understanding, take a look at the below image.
Retail traders: What can the inverted-hammer pattern reveal to them?
This question is crucial in technical analysis. It doesn’t matter what the symbol is called, but it does matter how the trade activity behind the pattern works.
The inverted hammer is the candlestick with the identical structure as the bearish pinbar. The trading activity that occurs in this formation is still important.
Before the bearish pi bar, for example, the bullish trend that indicates buyers control the market and are constantly pushing it up was always present. This is a market that has reached an extreme overbought state. A bearish bar appears with a long shadow indicating rejection of a high supply or resistance area. This indicates that sellers have taken control of the buyers, and buyers don’t have enough power to keep the price overbought. This will lead to sellers entering the market, which will cause a bearish tendency.
Three factors confirm that there will be a bearish trend. They are overbought and resistance rejection. These indicators indicate market activity at the time of formation the bearish bar.
The same thing can be said about the traders’ activity during formation of the Inverted Hammer pattern. It is a sign that there will be a bullish trend reverse.
Let’s read the price chart’s market activity during inverted hammer candle formation.
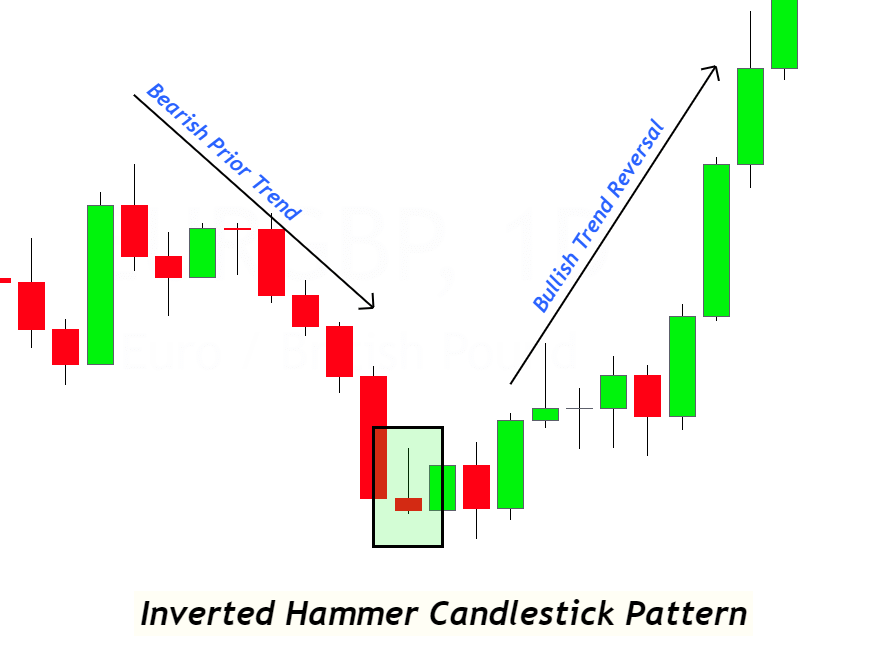
The previous trend is bearish before the candlestick pattern, signifying oversold situations. The sellers are working hard to lower the price. After forming an inverted-hammer pattern near a support zone, the bullish trend reverses. The reason this happened was that sellers were unable to keep the market in a bearish direction while buyers pulled the price higher and overtook the 60-70 percent of the bearish candlestick.
The chart indicates the gradual decline in the bearish tendency at the resistance area and an oversold state, which allows buyers to boost the price by launching a bullish new trend. This chart is a simple reflection of the psychological beliefs and actions of retail traders.
The slowdown of bearish trends is represented by the inverted hammer candlestick.
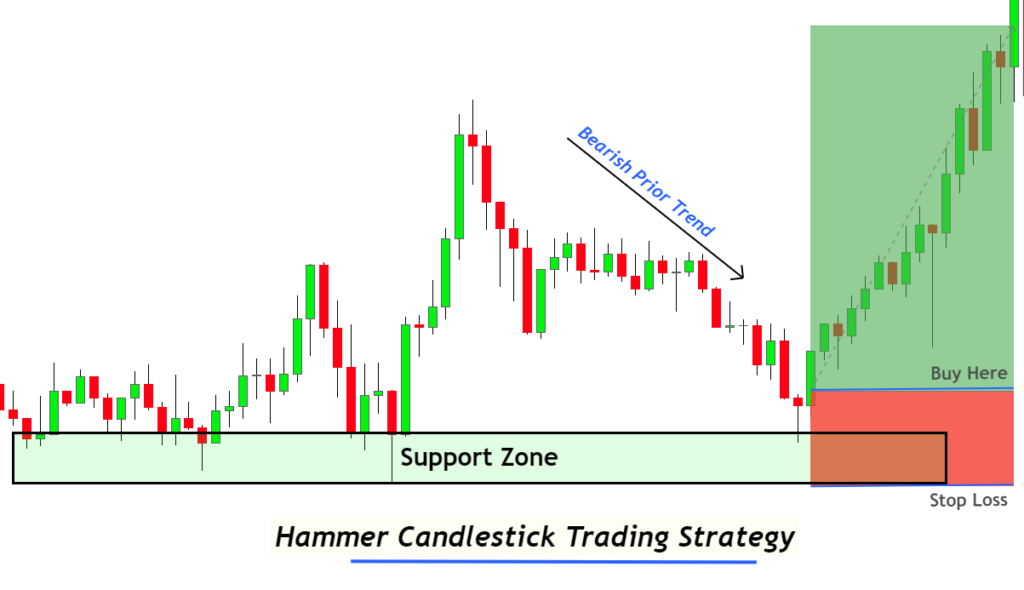
Intraday trading strategy for the inverted hammer candlestick
The confluence between technical indicators, like Fibonacci levels, support zones, or technical indicators, is what makes a candlestick pattern tradeable.
Tip: However, the main drawback to the inverted-hammer pattern is the fact that it doesn’t tell traders what their targets levels are. This only indicates the order open and close levels on the price charts.
Here’s the explanation of order opening and stop-loss level when an inverted candle forms on the price chart.
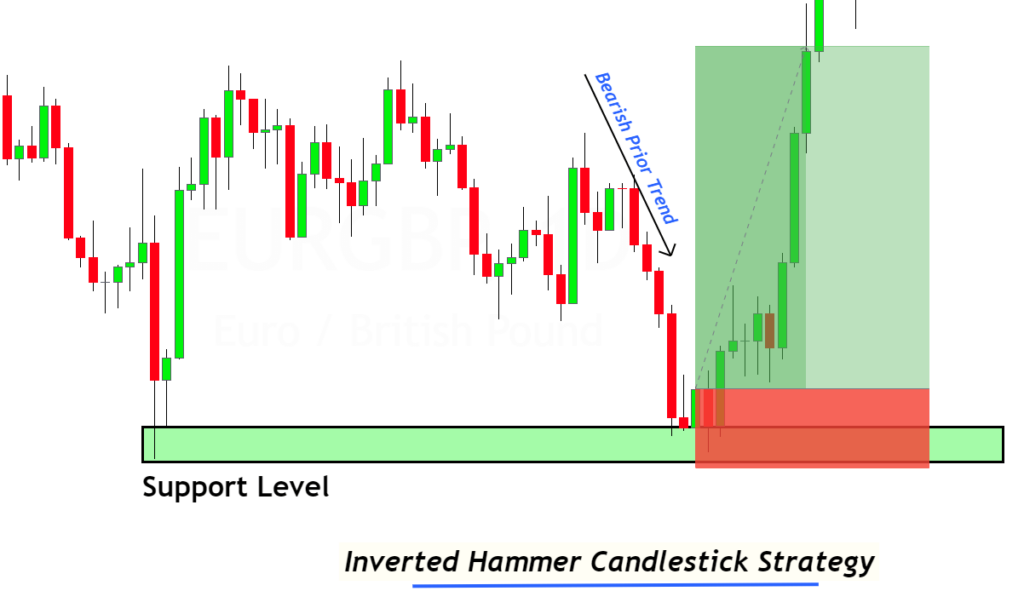
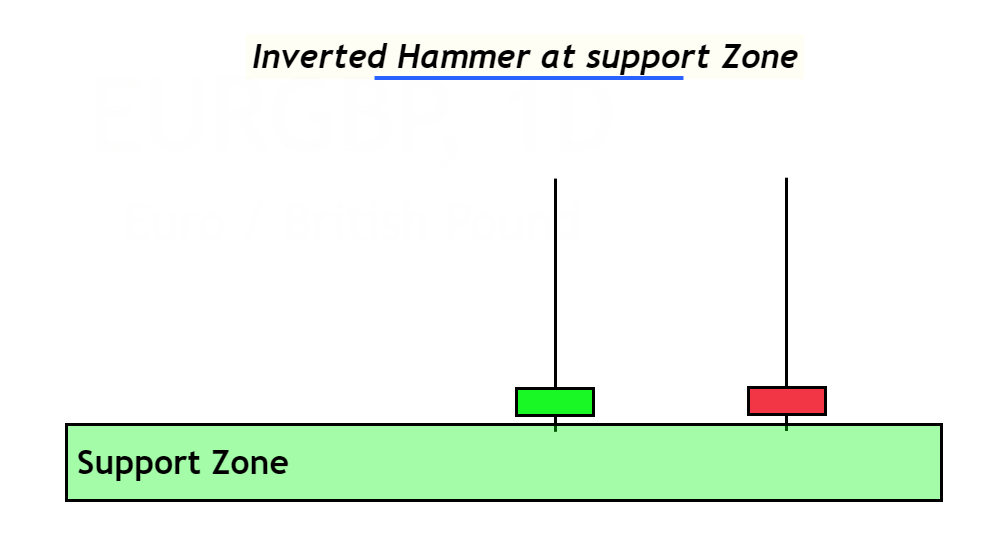
Inverted hammer at support zone
In technical analysis, the support zone is indicative of a bullish trend reverse. The same analysis can be seen in an inverted-hammer candlestick. If two patterns are formed simultaneously, the likelihood of trend reversal is higher. Therefore, it is always a good idea to search for confluence support areas.
Order open for purchase
Wait for the next candlestick to form if an inverted hammer pattern is formed. After this pattern forms, place a buy order immediately and set a stop loss below the support or low zone. Adjusting the stop-loss should be done by choosing the lowest option.
Don’t open a trade if there is no bullish candlestick after an inverted hammer or bearish pattern.
What’s the Bottom Line?
Candlestick patterns are the foundation of technical analysis when trading. But, it is even more crucial to understand the patterns. I will also tell new retail traders that you shouldn’t even need to remember the names of candlestick patterns. However, it is important to be able to accurately predict market activity. These are the characteristics of a professional trader.
This pattern should be backtested at least 100 times to ensure you are proficient in the inverted Hammer pattern.
Most Frequently Asked Questions
Is there a difference in the pattern of the bearish pinbar and the inverted-hammer candlestick? Both the bearish pinbar and inverted-hammer candlesticks are similar, however they both forecast an opposite trend reversal. While the inverted hammer signals the bullish trend reverse, the bearish pinbar indicates the market’s bearish trend change. The inverted hammer is formed after the bearish and other forms are after the bullish trends. Do you want the inverted Hammer pattern to have a green-colored or red colour? It doesn’t matter what color this candlestick pattern is. It is only the position of the inverted Hammer pattern that matters. The market will see a bullish trend reversed if the candlestick pattern is in either red or green. Is it the bullish hammer, or inverted hammer that has higher winning chances? Both patterns are different in terms of their winning chances. For forex traders, the bullish pike bar is preferred over the inverted Hammer pattern. Inverted hammer is mainly indicative of slowing down the bearish trend, while the bullish pin bar shows a false breakout at support zone. This strong sign of market reversal. Market makers will always attempt to create false breakouts before more important market trends. That’s why bullish hammer has a higher winning ratio in technical analysis.
[wptb id=16694]


Responses