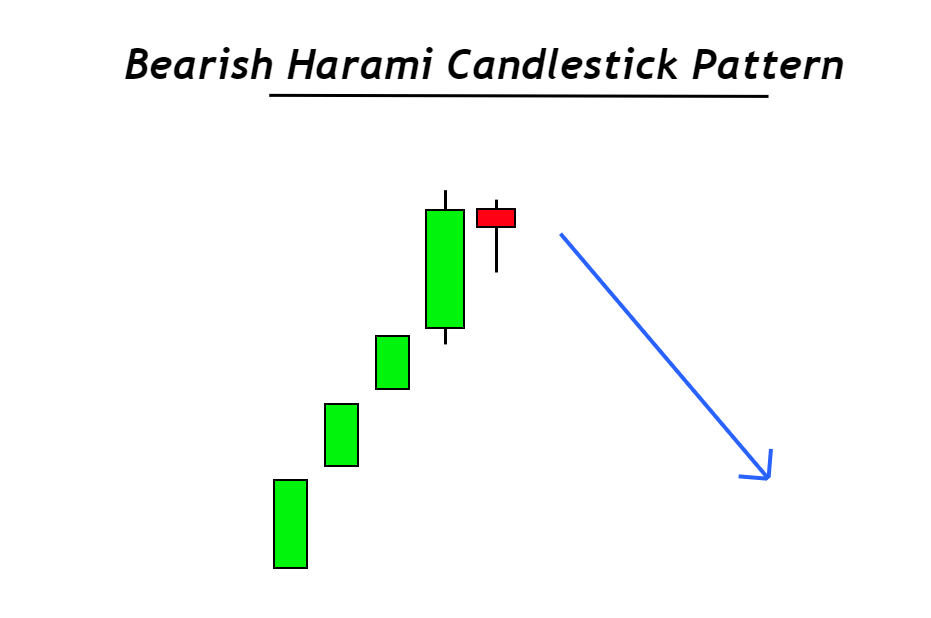
Bearish Harami Candlestick Pattern
The bearish trend reverser candlestick pattern known as the bearish harami consists of one large bullish candlestick, and one small candlestick within the range of a Bullish candle. You can also call it a bearish in-bar pattern.
Retail traders typically use the bearish harami patterns to predict the market’s upcoming trend reversal. It primarily forms after the bullish trend’s end and signals the start of the new bearish trend.
[wptb id=16694]
Jn this post, you’ll learn about the bearish harami pattern in detail with a profitable trading strategy. You can read and then practice the strategies to improve your trade skills.
You want to know how to recognize bearish-harami candlestick patterns.
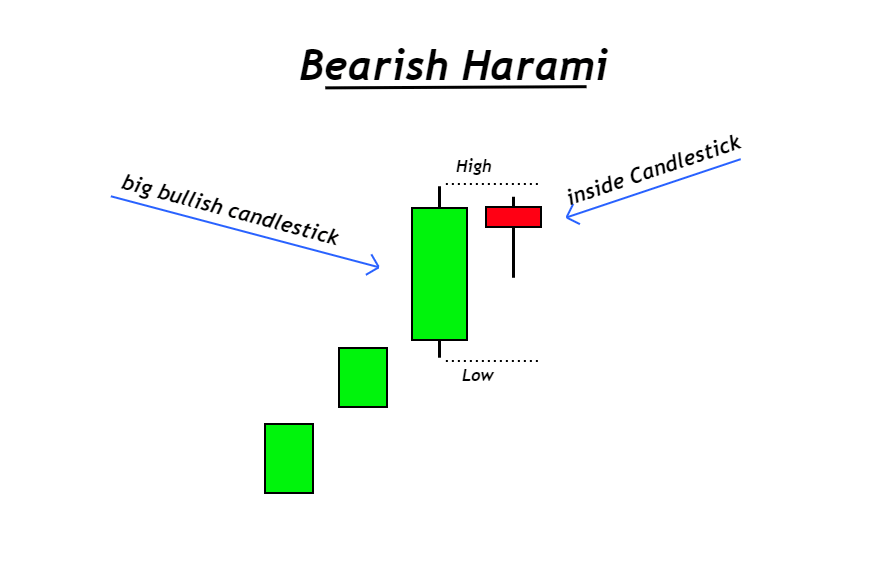
Two candlesticks make up the bearish harami design. It is the candlestick structure that determines how bearish harami candlesstick patterns are made. That’s why I have explained some rules you can use to identify bearish harami patterns correctly.
- Bullish will be the first candlestick. It should have a body-to wick ratio greater than 60%. This means that it must have a larger body than its shadows.
- It will be smaller than the first candlestick. The range for the bullish candlestick will be the same as the second. The trend will have a lower high/higher low.
These are two simple steps that will allow you to distinguish high-probability candlestick patterns from the rest. The noise in the price charts can make it hard for traders to see the patterns. If you create rules you will find patterns with high probabilities.
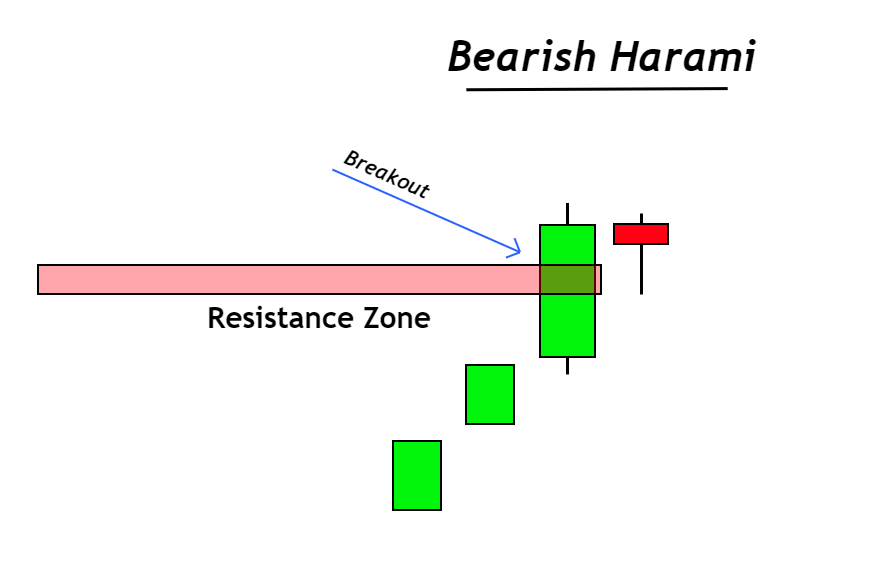
Bearish Harami Pattern Location
This is the key step in the bearish Harami pattern. Because without this, you’ll not be able to make profitable trades.
The location of the Harami candlestick pattern is an important step. A bearish Harami must be formed at the conclusion of a bullish or overbought trend.
- Bullish should be the previous trend.
- Price should not be below 50 psi during bearish harami candlestick formation.
When looking for a bearish pattern in the price chart, you need to be aware of the following conditions
- The downtrend should not cause it to form.
- You should keep it from forming in varying market conditions
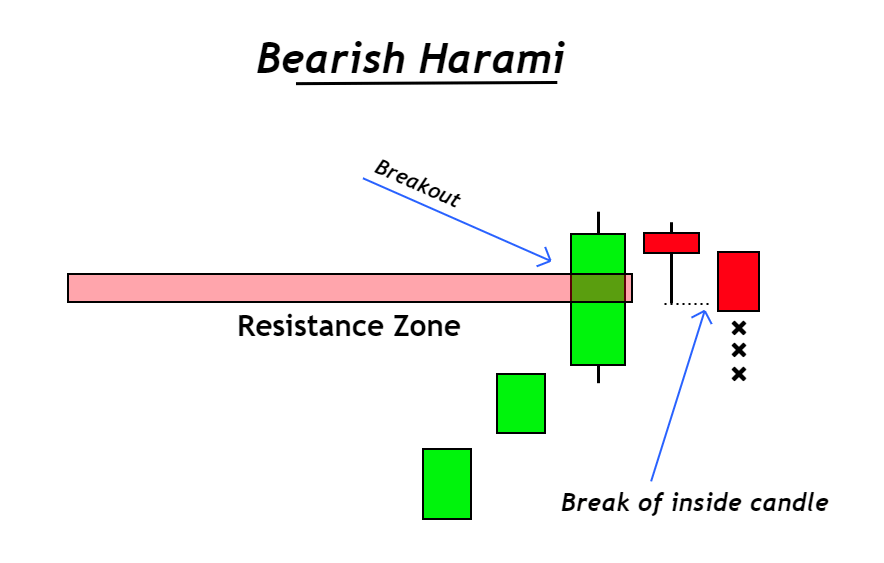
Inside candlestick breaks out
Indecision is evident in the formation of small candlessticks within the same range as the last candlestick. This confirms that the trend is reversing by the breakout of an inside candle. That’s why the inside candlestick should break in a bearish direction, and a bearish harami pattern will form.
This pattern is only a harami before breakout.
What is the meaning of the bearish Harami pattern for traders?
To predict future trends, a technical trader follows only price patterns. It is important to understand the psychology of each price pattern in order to make better trading decisions.
This is the main lesson to take away from this article. You need to know what the big traders are doing behind the candlestick chart. How do you know this? Let’s understand the psychology behind the harami candlestick pattern.
There are many opportunities for a price correction if a bullish tendency enters an overbought area. It is nature that if the price rises, it will surely come back. Prices move in cycles.
Additionally, bearish trends are more likely to reverse after a bullish pattern ends or when there is an overbought situation. After a large bullish key level breakout, the inside candlestick forms shows that price is making decisions about its future direction. This can be seen due to the inside candles. It is clear that the bearish trend has been established when the price breaks through the lowest candlestick.
Both the Bearish Harami pattern and overbought conditions both indicate a bearish trend reversal. The probability that there will be a bearish turn in the market will rise, which could lead to winning trades.
That’s why you should focus on reading the price.
Bearish Harami pattern trading strategy
The strategy that I’m going to teach you here is a pure price-action-based strategy. However, if you’re a newbie or intermediate trader, you can also use the RSI indicator as a confluence.
It is a sell-trade strategy, which means you’ll only open sell trades with this.
The following confluences form the basis of it:
- Trend for the Daily Timeframe: It should be bearish
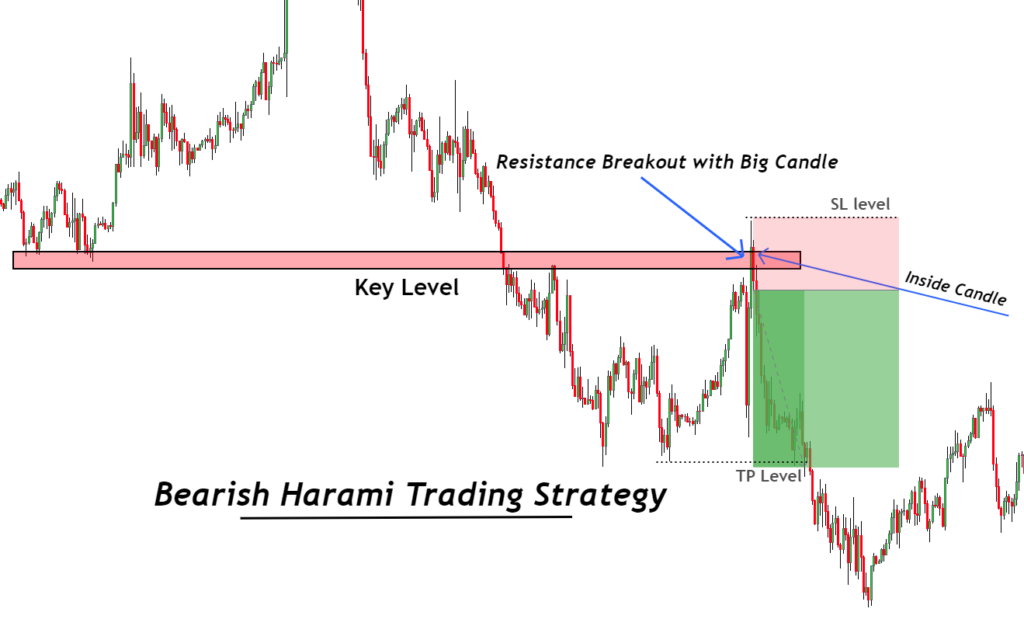
- Resistance level key: The big bullish candlestick must break a resistance level.
- Breakout: In the bearish direction, the candlestick inside should be broken.
- To identify excessively high prices, you may also be able to use price action methods. The RSI indicator is recommended for intermediate traders. You should aim for 70.
Trade open
Checking the daily trend is important. Prices will tend to form lower lows or higher highs. Next, look for a bearish pattern of harami at key resistance levels.
Place a stop-loss above or below the resistance area and open a trade to sell on the breakout the the inside candle.
Adjust the levels of take profits to 61.8 Fibonacci. This is the same level as the low in the last bullish wave.
Last words
It’s the most popular candlestick pattern. It’s one of my favorite candlestick pattern. This pattern is also great for checking trend reversals.
It is recommended to only use the pattern for shorter periods of time, like 5M and 1M. This pattern can be used in swing trading or intraday trading. It is possible to create bearish harami patterns in both the daily and weekly time frames.
This candlestick pattern should be backtested at least 100 time to ensure you master it. You will find this pattern very helpful in your trading.
[wptb id=16694]


Responses