Bullish Harami Candlestick Pattern

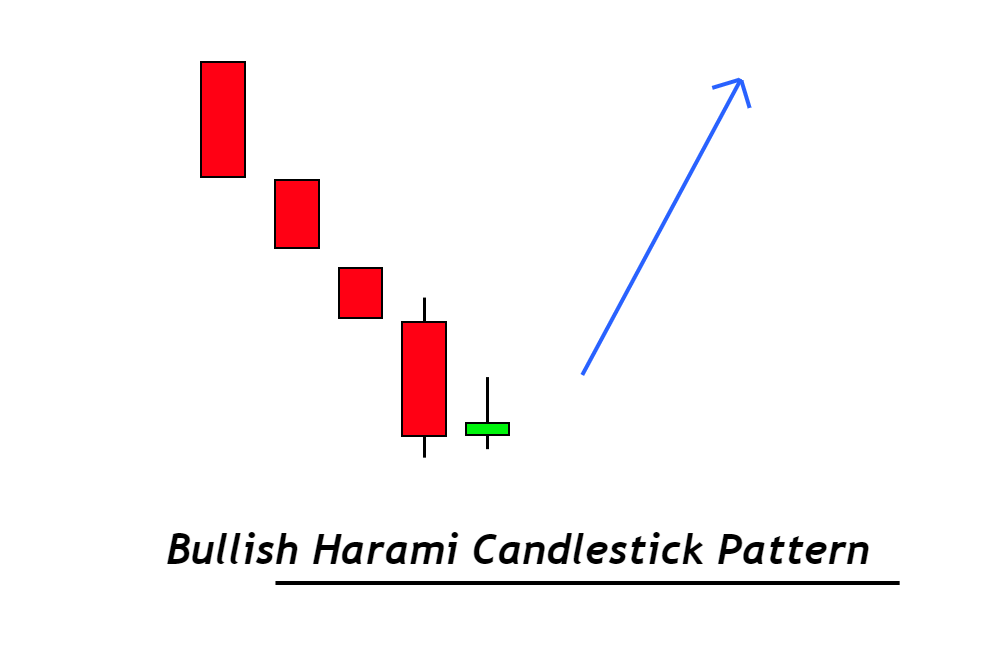
The trend-reversal pattern of bullish harami candlesticks consists of one large bearish candlestick and one small candlestick. You can find the small candlestick within the same area as the old bearish candlestick.
Harami also goes by the name of inside bar. It is used most often by retail traders because it acts as a decisive candlestick. This candlestick determines whether a trend is changing from a bearish to a bullish one. Bullish harami patterns have a greater winning rate in a shorter timeframe.
[wptb id=16694]
This article will provide a guideline for bullish harami patterns and a trading strategy. This pattern has a high risk/reward ratio because it uses a tight stop loss.
How do you identify bullish harami patterns?
The most important thing is to identify accurate candlestick pattern. Because if you find wrong patterns on the price chart, it will lead to a loss in trading, and you’ll suffer many psychological factors. That’s why I have explained the structure of bullish harami in the steps that are following:
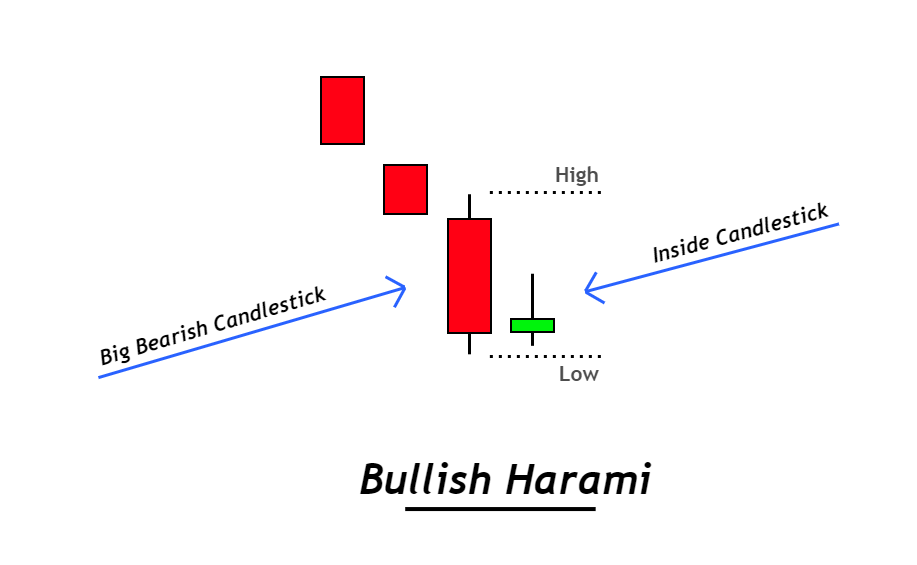
- It will be a large bearish-shaped candlestick that is used as the first candlestick. It should have a body-to-wick ratio of at least 60%. The wick will be small with large bodies.
- It should be within the same range as the last candlestick to form a small candlestick. This means that the trend in price is going to be lower at lows and higher at highs.
- Small candlesticks can come in a variety of colors, including red or green. It does not matter because the pattern’s structure is the most important.
The next step after identifying a bullish harami candlestick pattern is to add confluences.
A bullish harami candlestick pattern will be more likely to win if there are two confluences.
- Placement of the candlestick
- Breakout from inside candlestick
Emplacement of Harami Candlestick Pattern
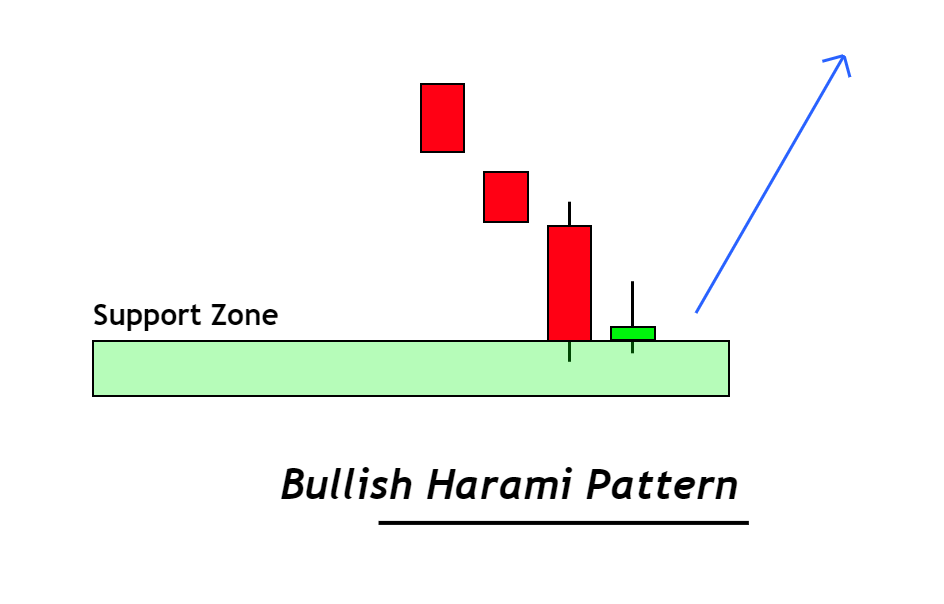
Location of the candlestick relative to the price chart is critical. Because mostly trend reversal candlestick patterns don’t work in ranging or choppy market conditions. It is always advisable to add a location filter into your trading strategy.
- It should be formed at the top of the current downtrend. The prior trend to form this pattern must be bearish.
- It must form when there are oversold prices.
If you’re a beginner or intermediate trader, you can check the oversold conditions using the RSI indicator. The best method to verify the oversold condition is price action.
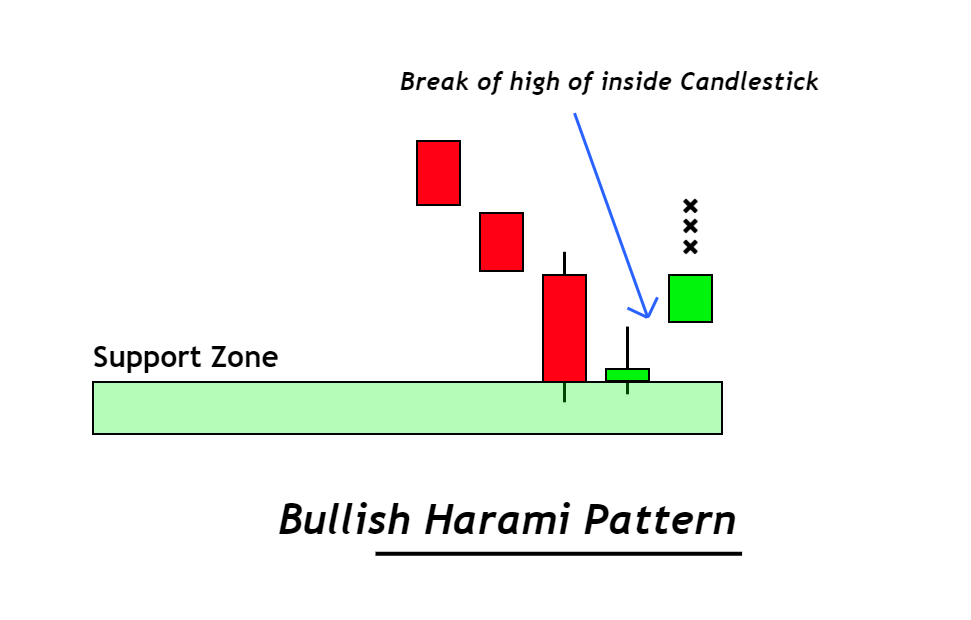
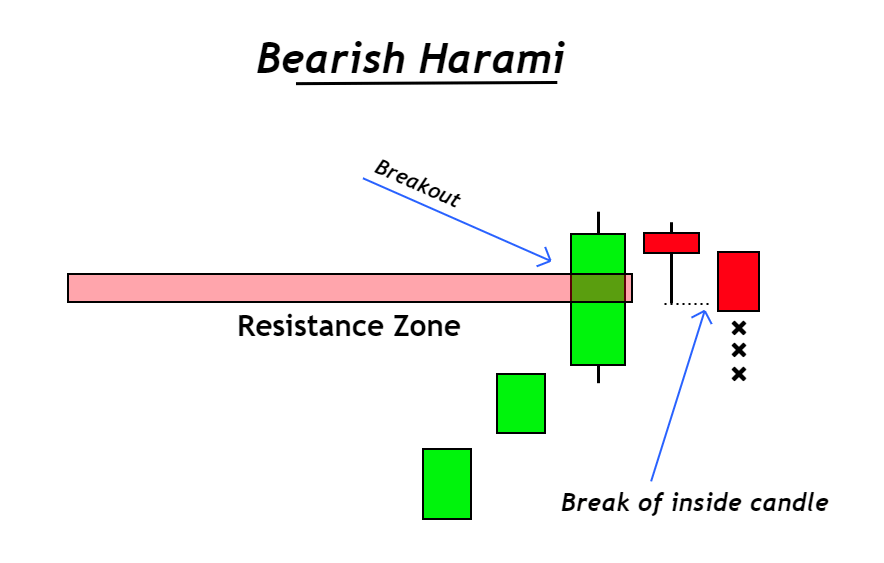
Harami Pattern Breakout
The inside candlestick will be broken after the candlestick has formed the harami pattern. The market’s future trend is confirmed by this breakout.
Because it’s a bullish trend reverse pattern, the inside candlestick should only be broken in the bullish direction. If it is broken in the bearish direction, this pattern will be invalid.
What can the bullish Harami pattern reveal to traders?
Advanced technical traders can see the price action and determine whether there are any active candlestick charts traders. You will need screen time to achieve this ability. It assists traders in accurately assessing market conditions.
Let’s understand the activity of traders behind the formation of the bullish harami pattern.
As I mentioned, the previous trend prior to the harami pattern would be bearish. The market is dominated by sellers, which means that the price of the product is declining. Sellers cannot push the price up enough. When the price is at a critical support level, or in an area that has been oversold, sellers begin to feel weak. Sellers are losing their strength because they’ve used all of their potential, and buyers are growing stronger.
Market makers create a bearish signal by putting up a bearish candlestick in order to catch retail traders at certain key support levels. The next candle was a smaller candlestick within the range. This indicates that the market makers have decided to either continue with the bearish trend, or reverse it. The bullish market trend will be confirmed when the price breaks the inside candlestick.
These two confluences of bullish trend reversal confluences increase the likelihood that trend reversal will occur. We will also benefit from price chart analysis when we trade in bullish direction with market makers.
It works this way.
What is the best way to trade bullish Harami patterns in Intraday?
Four confluences make up the bullish harami candlestick strategy:
- Bullish on the daily timeframe: This should indicate a bullish trend. It is easy to trade in the direction of the trend.
- Important support level: Bullish haramis should appear in a support area. You can also adjust the safe stop loss.
- Breakout: In bullish, the inside candlestick must break.
- Conditions that are oversold: The price must be within the region of the oversold level or lower than the 45 RSI. To determine oversold condition, you can use price action.
These four confluences create a strong probability of forming a trading signal.
Trade open a Buy
Open a buy order immediately after the breakout on the inside candlestick. Place your stop loss at the support zone.
The Fibonacci drawing on the bearish wave determines your take profit level. You might be able to keep the trade open for a shorter timeframe.
Let’s get to the bottom
Every trader who uses technical analysis trading should know the Harami pattern. This is my favorite pattern and it helps me identify market trend reversals.
Learn the Inside Bar Pattern to get more information.
[wptb id=16694]


Responses