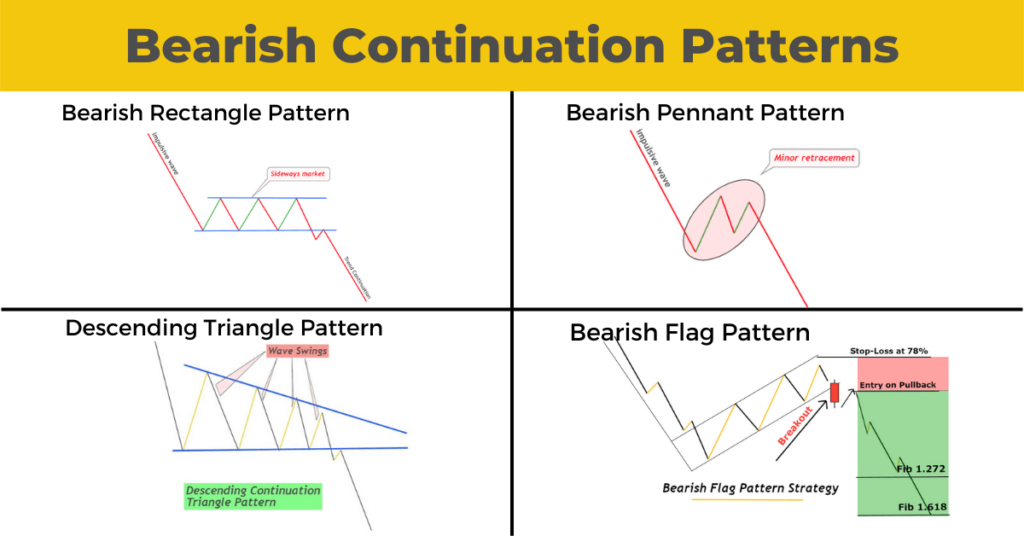
Bearish Continuation Patterns
[wptb id=16694]
Definition
These chart patterns indicate the continuation of the bearish financial market trend.
Retail traders can use four types of bearish continuation pattern in their technical analysis. Retail traders use these patterns to predict the bearish trend by looking at the candlestick charts of various financial markets.
These continuation patterns are only able to forecast the trends. They don’t forecast the price against the trend. That’s why the winning probability of trend continuation patterns is always slightly more significant than the trend reversal patterns.
There are many types of continuation bearish patterns
These are some examples of bearish continuation patterns:
- Bearish pennant pattern
- Bearish flag pattern
- The ascending triangle pattern
- Bearish rectangle pattern
These four patterns only give a sell signal. You’ll always open a sell trade after the formation of these patterns. To make more profits, you could also open a sell trade after the formation of bearish continuation pattern.
What are the best ways to identify bearish continuation patterns of behavior?
For high probability charts, it is important to learn how to spot repeated price patterns. Each price pattern has been explained. You can learn even more by clicking on the Learn More button located at the bottom of each pattern.
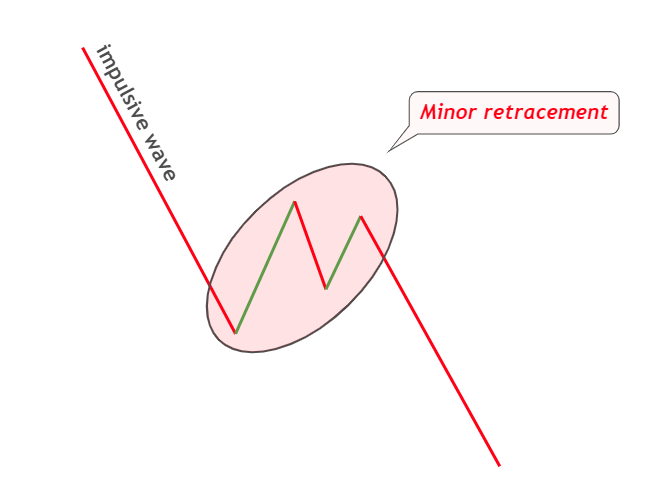
Bearish pennant pattern
It is called a bearish pennant when there is a slight retracement that forms following a huge bearish impulse wave.
Within the minor retracement, there are 3-4 small waves. Each successive wave will become smaller. After three to four waves are formed, the price will begin breaking the structure downwardly and will enter a bearish tendency.
A strong seller trend is necessary for the bearish impulsive wave to look like a flagpole. A minor retracement can be used as an indicator at the pole’s end. This simple price structure is behind the bearish pennant patterns.
More information
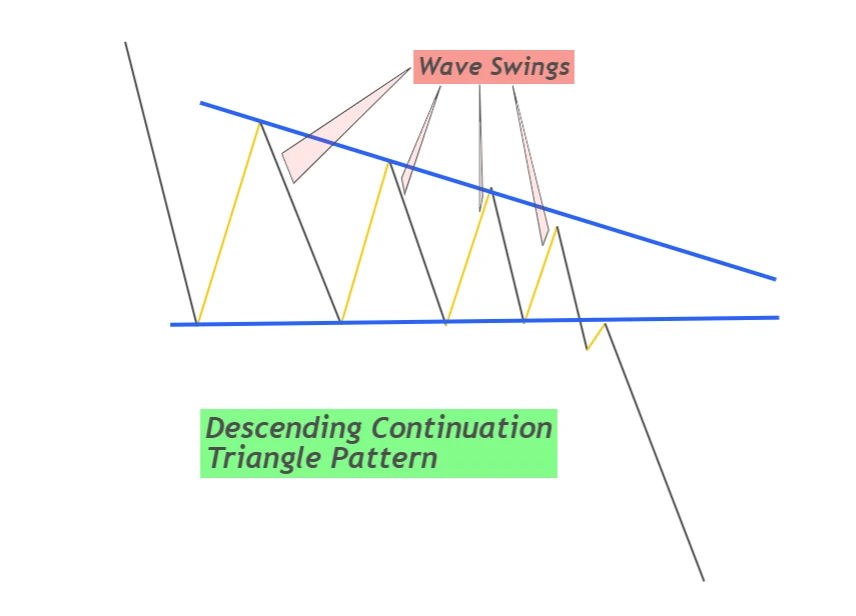
The ascending triangle pattern
A price structure called the descending triangle is one that looks like a ball bounced on the ground. Each bounce brings down momentum.
The floor acts as support, while the trajectory of the ball is used to create price waves. This pattern will see the price bounce off a support area, with each bounce being smaller than the last. Take a look at this image to get a better idea of the chart pattern.
First price waves will produce the biggest wave, then smaller waves. The price will form three to five waves before breaking the support zone. A bearish trend will then begin.
A Descending triangle is a good indicator that bearish trend continuation is occurring. This is one of the most commonly used patterns for technical analysis and trading.
More information
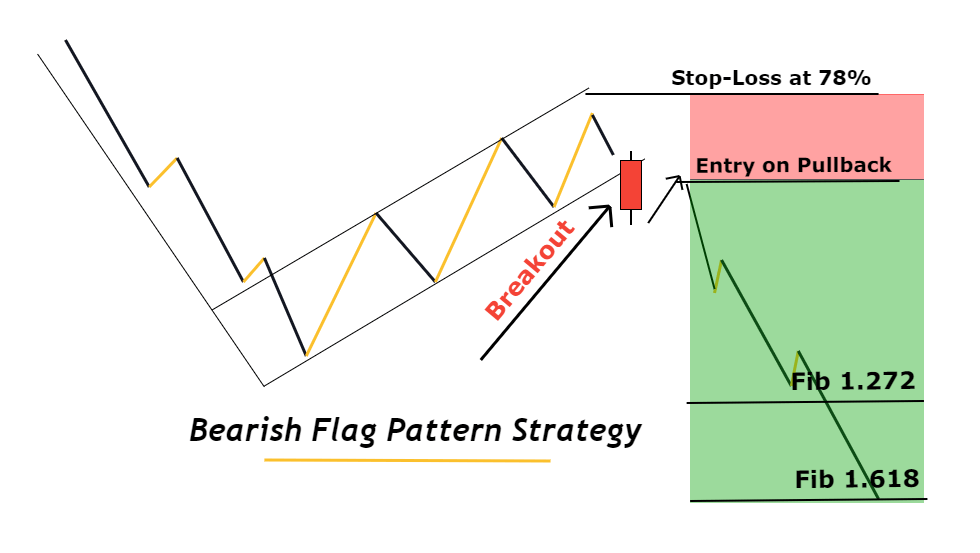
Bearish flag pattern
The bearish flag pattern is somewhat similar to that of the bearish pennant. The flag size is what makes it different.
For a bearish pattern with a pennant or flag, there will be a small retracement.
Two components make up a flag: a flag and a pole. The flag is the bullish trend, and the pole the bearish impulsive wave. This pattern will show a bullish channel as the retracement. A bearish trend begins when the channel is broken.
Three things must be checked to identify bearish flag patterns.
- Pole: Bearish Impulsive Wave (pole).
- Bullish wave of retracement within the price channel (Flag).
- Breakout in the price channel
Once you have identified these price patterns, it is time to place a sale order.
More information
Bearish rectangle pattern
A rectangle pattern in trading is a symbol of a sideways/consolidation market structure. However, if the consolidation is formed after a downward trend ends and moves in a bearish manner it can also be a symbol for a continued bearish trend.
Take a look at the picture below to see the pricing structure.
You will notice a bearish tendency or formations of lower lows, and higher highs in the first phase. A rectangle-shaped price structure with sideways will emerge in the second phase. In the third and final phases, the price will break through the rectangle. A new bearish trend is expected to form.
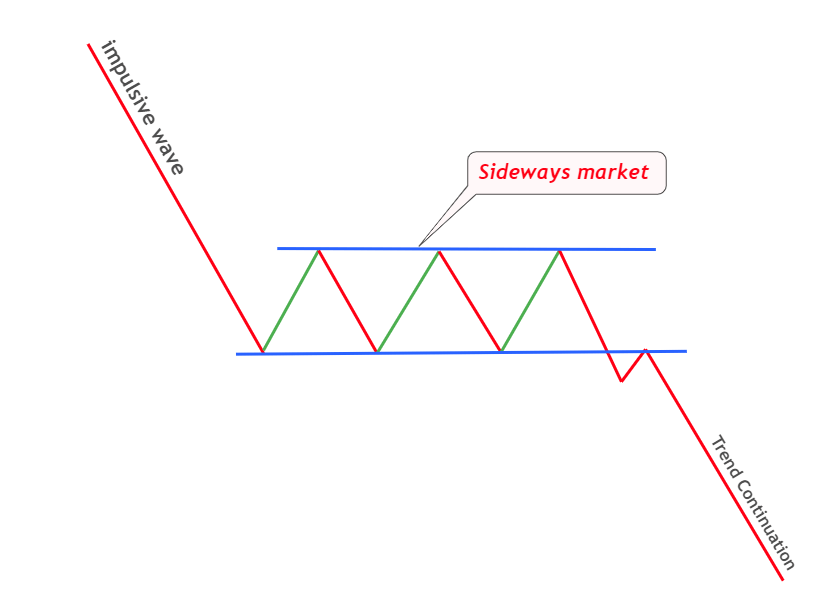
The rectangle should always break in the upward direction. It will be a trend-reversal pattern if it is broken in an upward direction.
Conclusion
You can become a profit-oriented trader only if you master these four patterns. You don’t need to learn many chart patterns but a few patterns only. Simpleness is key to trading success. Trading psychology can overwhelm you if you create a complicated trading strategy. You will eventually lose.
Keep it simple, and you can start trading following these rules.
[wptb id=16694]


Responses