Bullish Continuation Patterns Overview
Bullish continuation patterns are chart patterns that indicate the continuation of bullish price trends for a particular currency pair.
They are very rare but are highly important. These patterns can indicate an increase in the currency pair’s price. A second thing to note is that they form in the bullish trends and also predict the direction of the trend which is a double convergence.
A chart pattern can also show bullish continuation if the trend is already bullish. Both price forecasts align with one another, increasing the chances of a bullish tendency.
[wptb id=16694]
These are the four best bullish continuation patterns.
In the technical analysis, four main chart patterns show that the bullish trend continues.
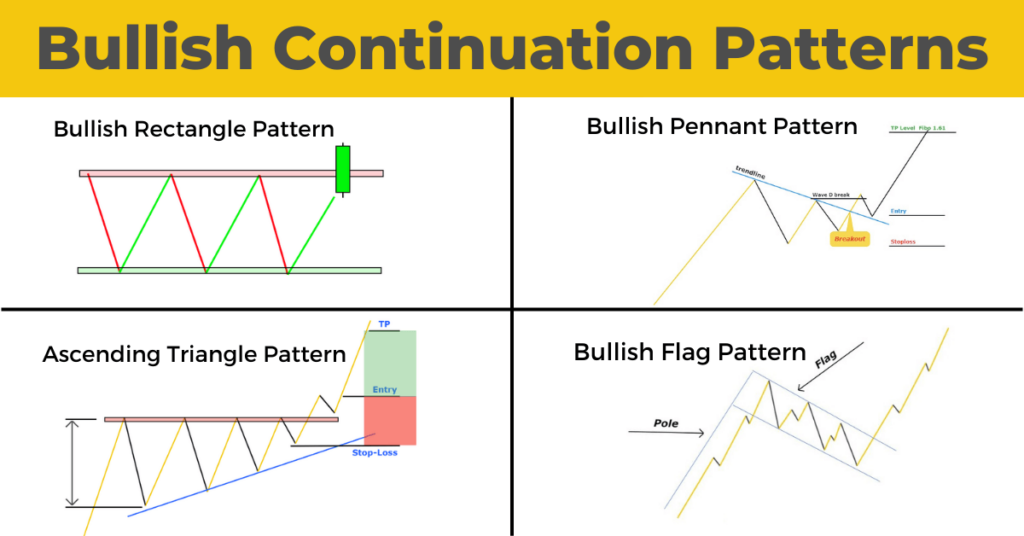
- Bullish pennant pattern
- Triangular ascending pattern
- Bullish Flag pattern
- Bullish rectangle pattern
In technical analysis trading, these are the chart patterns that traders must be aware of. In the case of bullish continuation charts patterns, a trader should always open a purchase trade.
What is the best way to identify bullish continuation charts patterns?
Below is an introduction to each chart. If you would like a more detailed explanation, click the Learn More button located at the end each pattern.
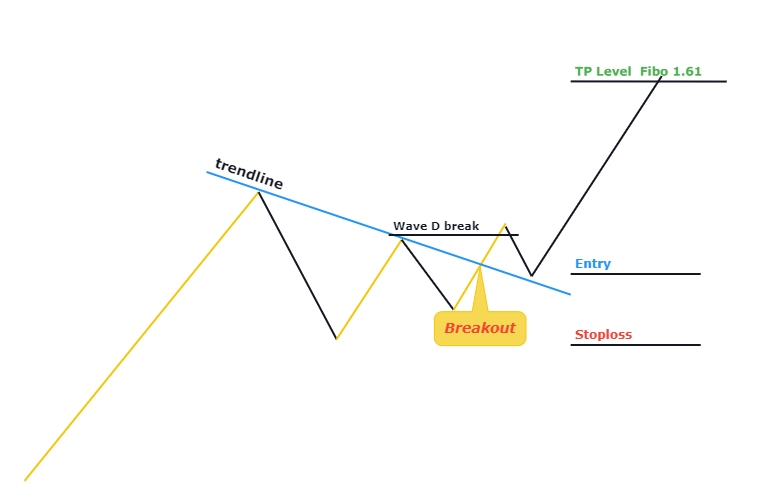
Bullish Pennant style
A bullish pennant is a combination of a bullish impulsive surge and minor price movement.
The Pole is represented by the impulsive price waves, while the small retracement that follows the impulsive waves indicates a flag. This is the flag and pole pattern.
In the first phase, you’ll have to identify a bullish impulsive wave. The bullish trend must exist. In the second phase of the impulse wave, a retracement wave is expected to form. Keep in mind, however that the retracement is likely to be smaller in scale.
The retracement’s subsequent waves will all be smaller than those of the preceding wave. A bullish trend is expected to begin after three or four more smaller waves. This indicates the continuation the bullish trend.
Learn more
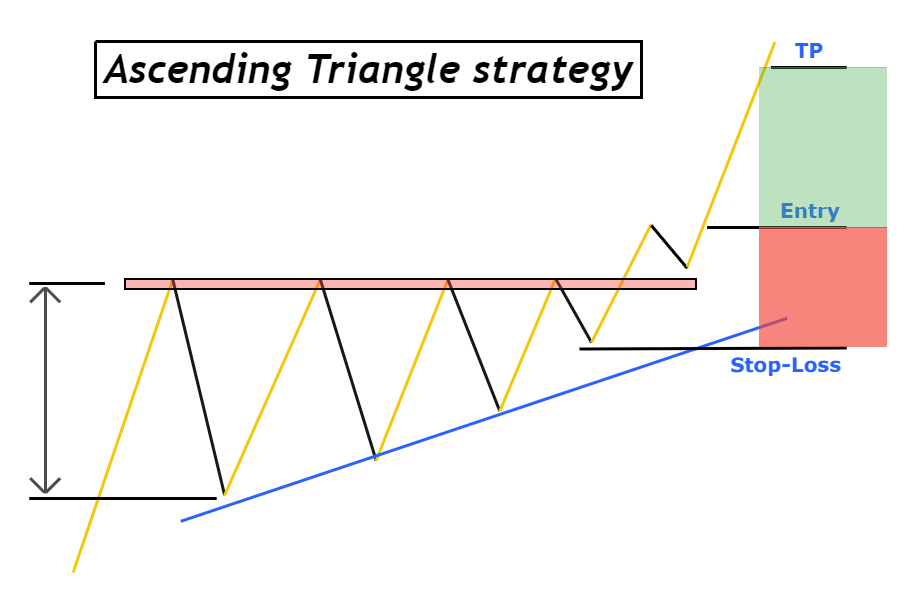
Triangular ascending pattern
The ascending triangle chart pattern is composed of both a resistance area and price waves that bounce from it.
This pattern is where the price bounces off the resistance zone. Each price bounce after the initial and largest price bounce will be less than the last price bounce. However, the resistance/base zone will be the same. The phenomenon will take the form of a triangular shape. That’s why it’s called ascending triangle pattern.
The resistance zone will be broken after at least three waves and then a bullish trend will begin.
Learn more
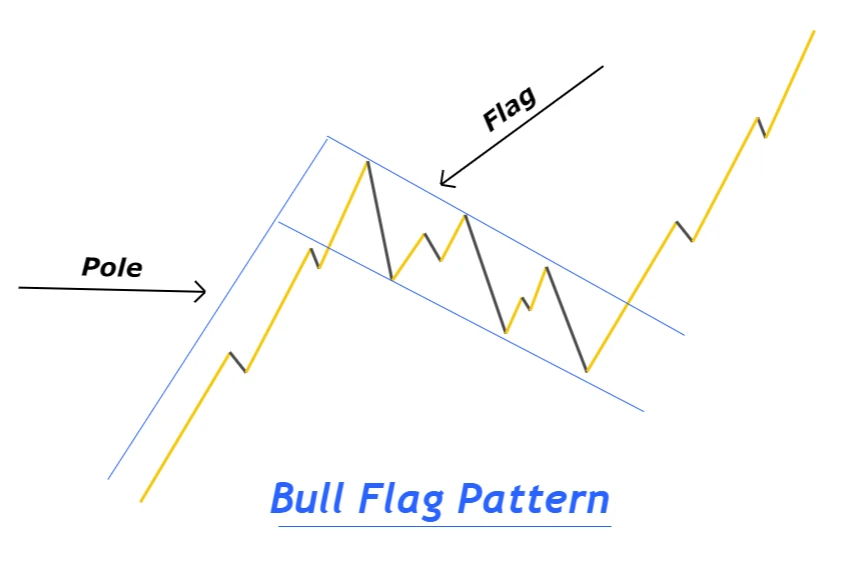
Bullish flag pattern
This is the flag and pole pattern of the pennant. However, in this flag pattern the flag size will be larger and there will be a substantial retracement wave.
A bullish impulsive wave with strong buyers momentum will first form. It will serve as the pole of flag. Following pole formation, price will start to fall towards Fibonacci 60 or 50 levels. This retracement is similar to a channel that follows a downward trend with alternating upper and lower boundaries. After breaking this channel, the bullish trend will be maintained and the market will experience a bullish impulse wave.
Trading with the bullish flag, which is the most common chart pattern used in trading, has high success rates and high risks.
Learn more
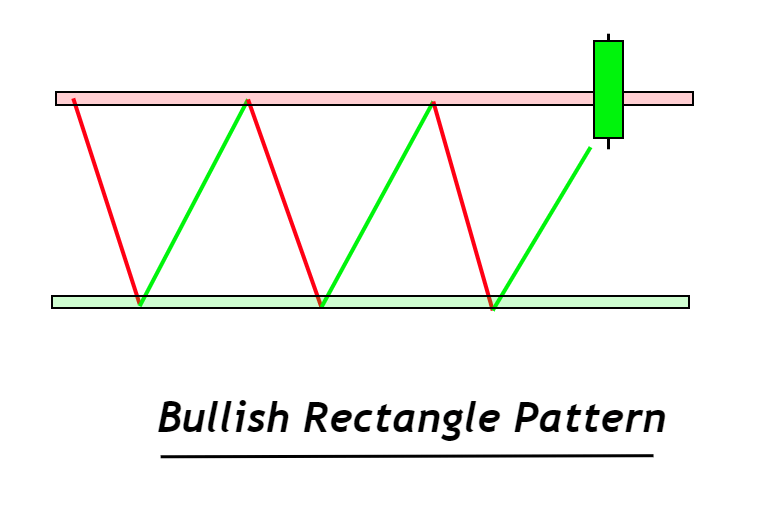
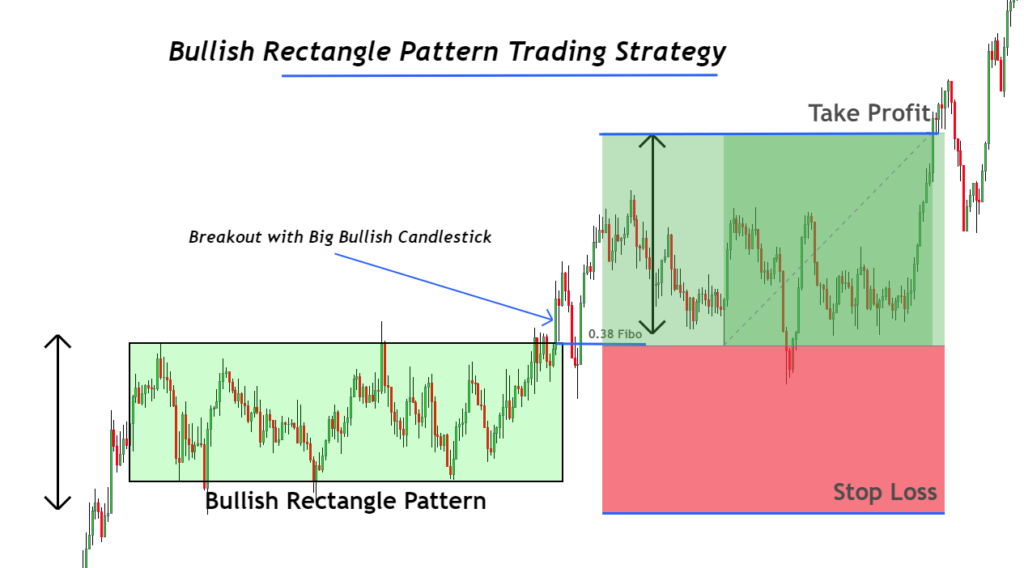
Bullish rectangle pattern
A continuation chart pattern, the bullish rectangle, is when the price moves sideways. After a resistance breakout it will keep its bullish trend.
If it breaks the support area, the rectangle can also be used as a reversal charts. But here, you’ll only look for rectangle patterns that break the resistance zone to open a buy trade.
This chart pattern is not a trending one. The price of the stock will be moving sideways. The price will move between a support and resistance zone, making highs and lowers. The support and resistance zones will continue to be supported by the price. The resistance zone will be broken and a new bullish trend will begin.
Learn more
Bottom line
Traders should limit the amount of trading patterns they use to create a winning strategy. Trading one pattern in profit is more profitable than trading 20 charts patterns in loss.
You should therefore tailor your strategy to suit your personality.
To get maximum information, I highly recommend that you carefully read every chart pattern.
[wptb id=16694]

Responses