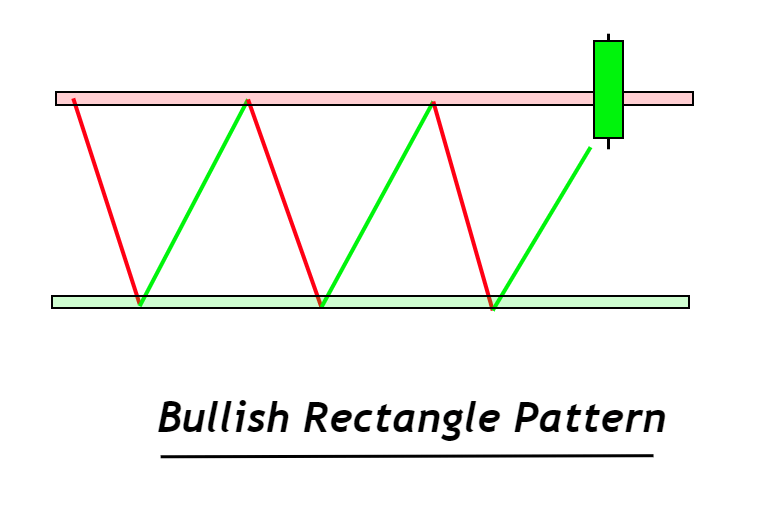
Bullish Rectangle Pattern
A bullish rectangle is a chart pattern where price changes sideways on a candlestick chart that has a bullish breakout.
The chart pattern can be used as both a trend continuation or trend reversal. Retail traders use this chart pattern mainly as a continuation chart pattern due to the high win ratio.
In this post, you’ll learn about both types of bullish rectangle patterns, along with a simple day trading strategy.
[wptb id=16694]
What is the best way to recognize a rectangular chart pattern?
The market condition is represented by the rectangle chart pattern. The chart patterns can be used to show how the price changes sideways. With time, the market follows a certain price range and forms a rectangular-like pattern on the chart.
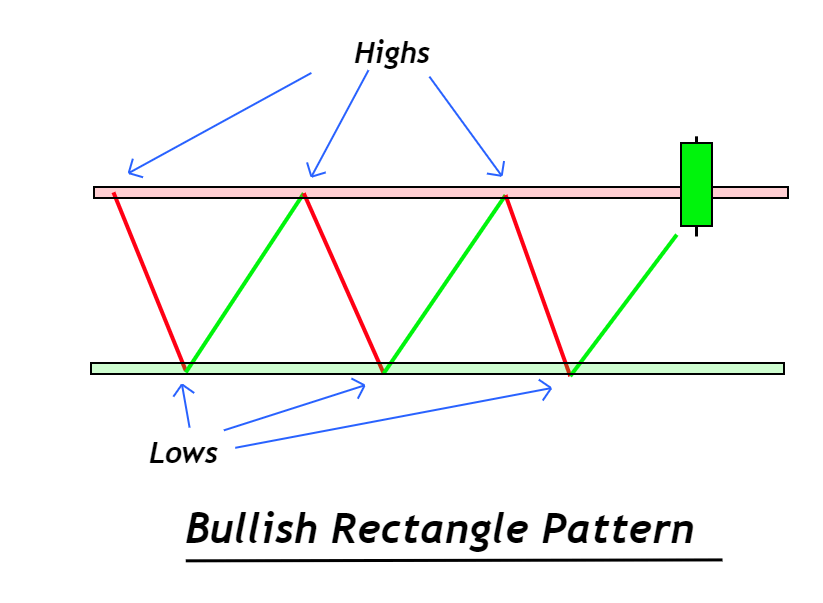
These steps will help you locate the rectangle pattern on your chart accurately.
- There should be two extremes in the price pattern.
- The resistance zone may have two price points, while the support zone might have two.
As you can see, the time is changing the direction of the price.
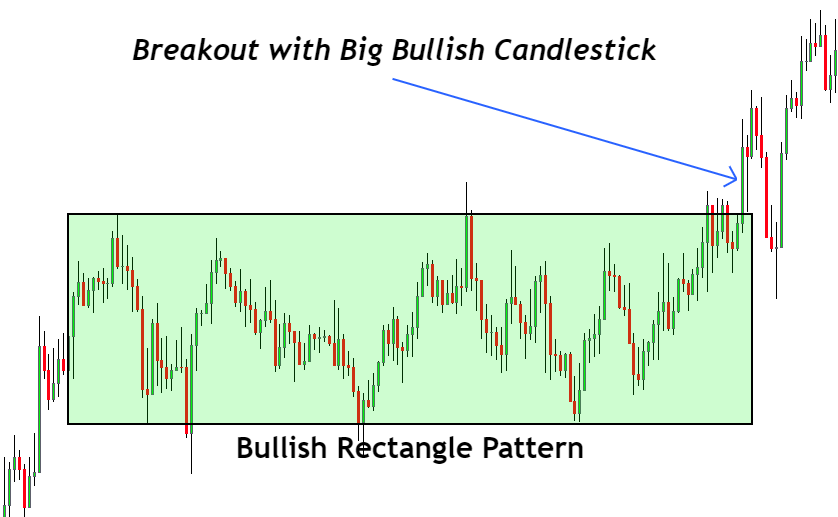
Breakout using a bullish candlestick
This is the first thing you need to check. There are many false breakouts in the market.
With a large bullish candlestick, a breakout is possible. Bullish candles should be large in body to-wick ratio. This is because it indicates a breakout. However, it is a valid breakout signal. Because small candlestick has low momentum and primary key level’s breakout always happens with a high momentum candlestick.
Different types of the bullish rectangular pattern
Two types of bullish rectangular patterns are based on the current market trend.
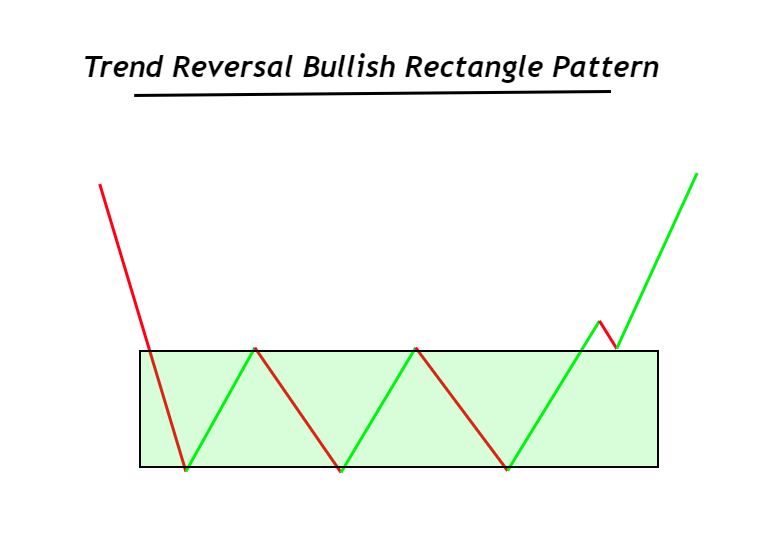
- Rectangle trend reversal pattern
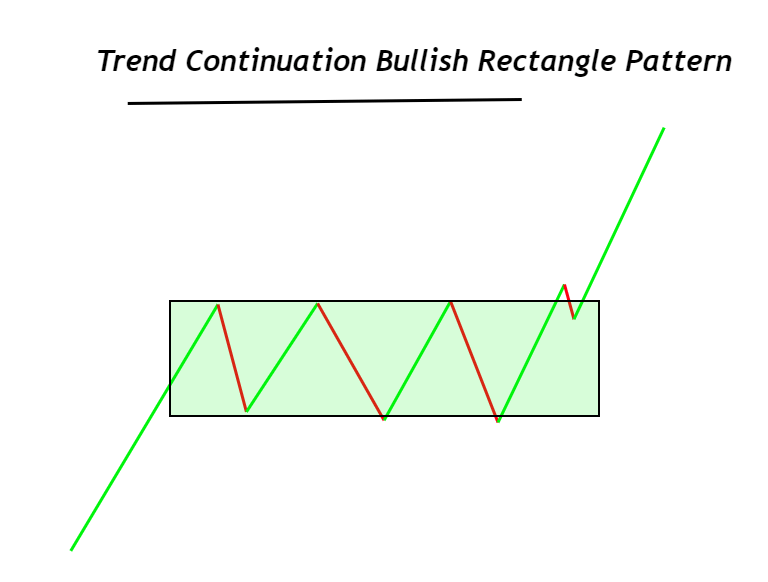
- Trend continuation rectangle pattern
If the trend reverses, then the bullish rectangular pattern will form after the bearish market. If the market is being pushed down by sellers, a bullish rectangle pattern will form. Then a bullish trend begins.
Because of the high number of false breakouts, this type is considered to be the most dangerous. This can lead to losses in trading. You can use it for confluence or analysis purposes.
The bullish rectangle pattern is formed during bullish trends if there’s trend continuation. This pattern is highly probable because it establishes the bullish trend’s direction. This pattern is widely used by retail traders to trade the market.
For a higher winning rate, I would recommend the continuation of the rectangle pattern rather than the trend reversal.
How does the bullish rectangular pattern help traders trade?
A rectangle chart is an indicator of market indecision. This means that big traders and institutions have decided their future direction. The breakout of the rectangle pattern in the price chart will determine the direction.
If the price changes sideways, buyers have almost the same power as sellers. That’s why prices move in a range.
However, when a bullish breakout of the rectangle pattern’s resistance zone happens, a bullish rectangle pattern form.
Only after breaking the resistance zone of bullish direction, the bullish rectangle pattern will be complete. Because the price is still in its decisive phase, it can start a bearish trend before the breakout. Only the breakout can confirm the market’s future direction.
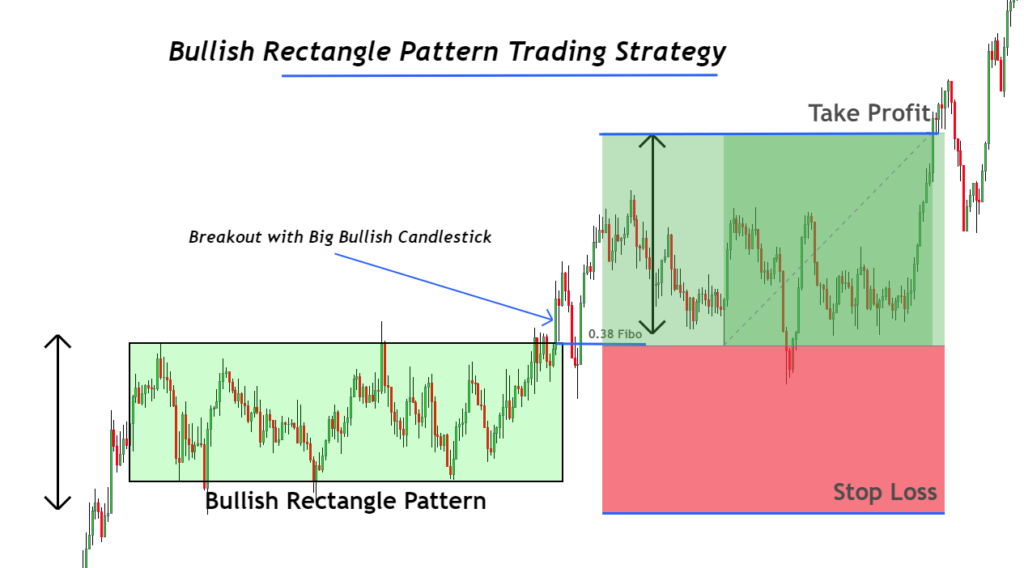
Day trading for the rectangle pattern
In this strategy, you’ll learn about the order entry level, stop loss and take profit level.
As a strategy consists of the confluence of three or more technical parameters, we’ll add three technical parameters here in the rectangle pattern strategy to increase the winning probability.
Here are the confluences that we’ll check before looking for entry, stop loss and take profit levels:
- Bullish should be the prior trend. It is a continuation pattern on the trend charts.
- With a bullish candlestick, the rectangle pattern’s upper resistance should be broken. This means that the price can break through the resistance zone at its full potential.
- Wait for the price of the breakout to return to the 38 Fibonacci levels from the previous wave.
These confluences are likely to result in high-probability trade setups on the market.
Purchase entry
After the breakout of the resistance zone, open a purchase order.
Stoploss
Place your stop loss below the bottom of the rectangle bullish pattern.
Profit Level
The distance between support and resistance in the rectangle pattern is called the profit level. It’s measured in pip. Project the distance to the resistance zone for the bullish rectangular pattern.
This is the day trading strategy that works best for the rectangular pattern.
Conclusion
Because the smart money invests heavily in big financial institutions and market makers, trading the trend continuation pattern is always a high probability trade. A retail trader who is against the market maker will result in his account losing all of its balance.
Confidence in technical tools is another important factor that will increase the success rate of any trading strategy. Confluences are a great way to create the perfect trading strategy.
To master the rectangle pattern, ensure you backtest it at least 100 times.
Most Frequently Asked Questions
Do you think the rectangle pattern is bullish or bearish Simple rectangle patterns are neither bearish or bullish. The market is indecisive, it simply displays the rectangle pattern. If the price breaks through the rectangle pattern, then a bullish or bearish market trend is confirmed. A bullish rectangle pattern will form if the price crosses the resistance zone. If the support zone is breached, then a bearish rectangular pattern may form. Which rectangular pattern is better for trading? High probability patterns always form in the direction that the trend is heading. The probability of trading success increases when a pattern forms in the direction of a major trend. A bullish pattern that forms in a bullish trend will be more likely to win. A bearish pattern, on the other hand, will be more likely to form within a bullish trend.
[wptb id=16694]


Responses