Camarilla Pivot Points Indicator
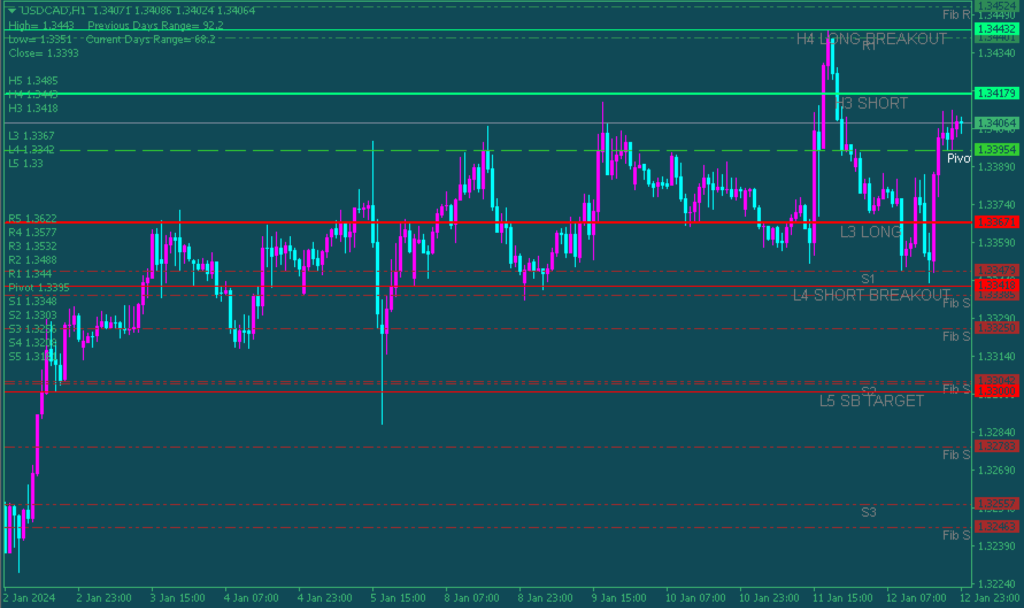
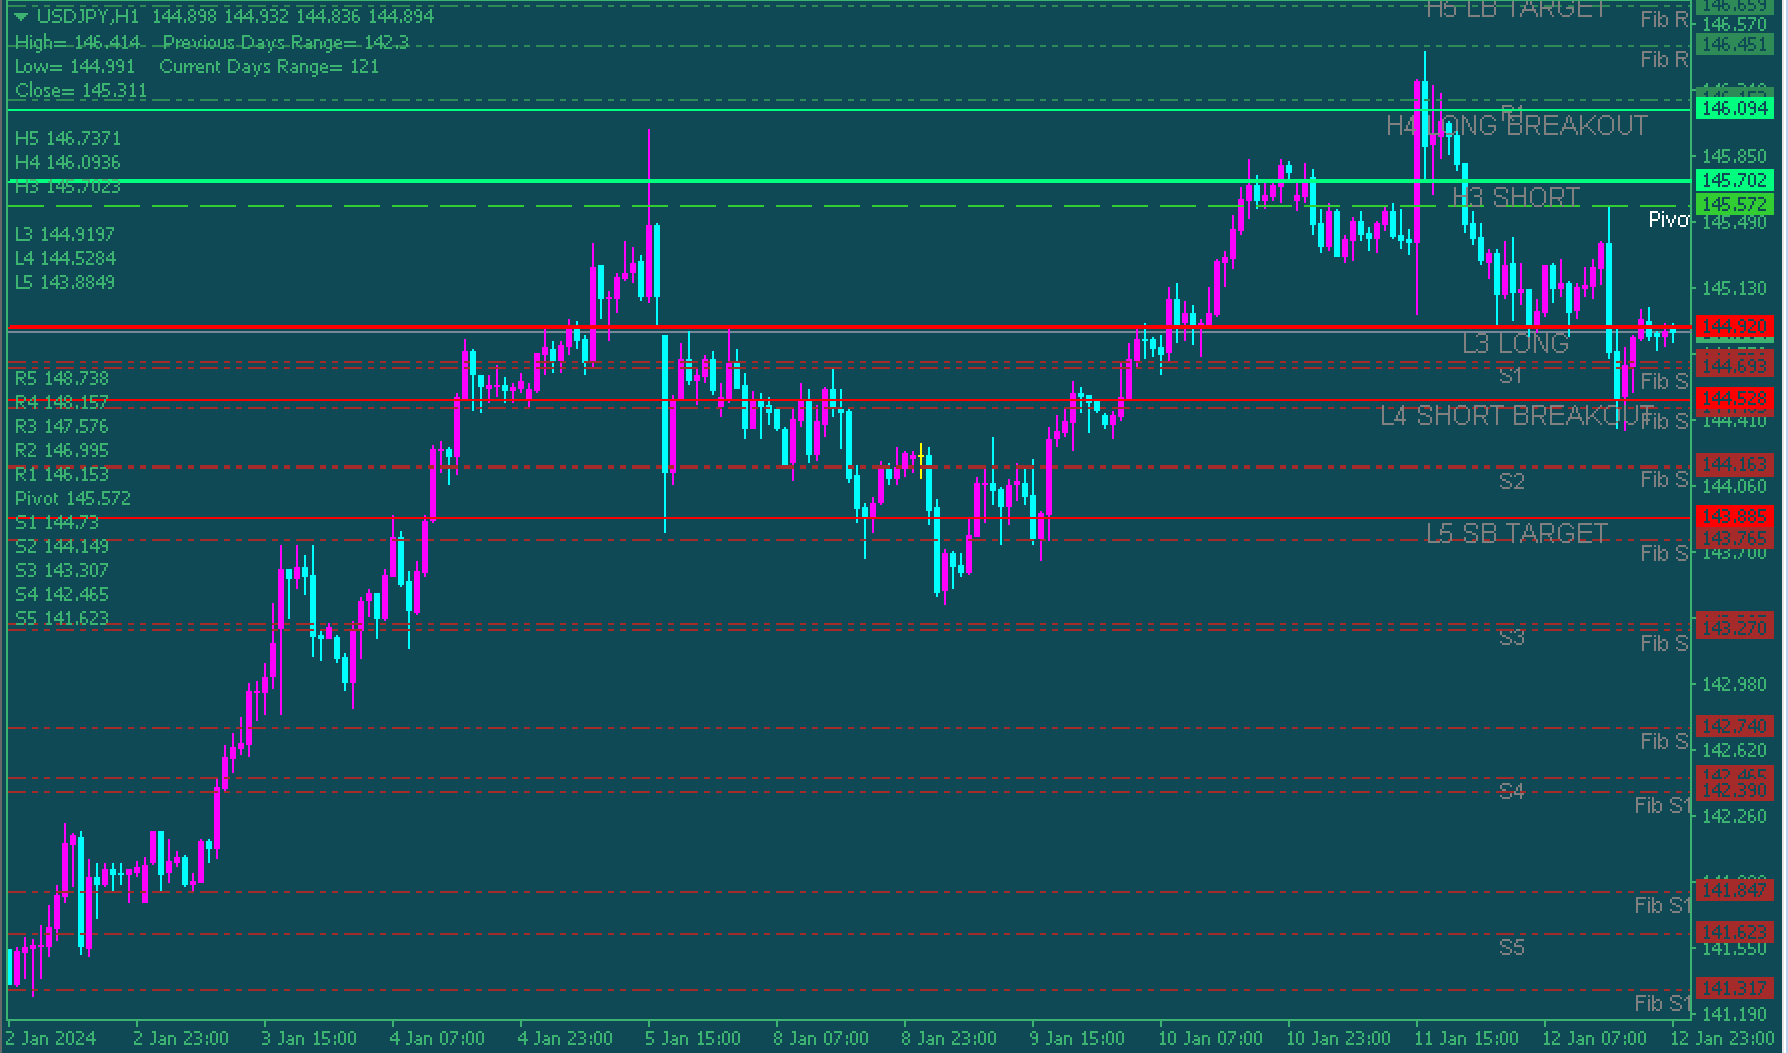
This Camarilla Pivot Points Indicator is an MT4 indicator with a simple design that provides information on levels of support and resistance. The classic Camarilla Pivot Points are a mathematical indicator that utilizes prices from previous days’ highs, lows, and closing prices to form lines of resistance and support in the graph. Nick Scott created it.
The indicator takes the calculations of indicators that are traditional and applies the same calculations to create a new one. It also creates additional lines of resistance and support. There are 17 lines using Fibonacci numbers. If a price rises over the top resistance line, it’s a significant downtrend, and if it is below the support line at low, it’s a strong upward trend.
It is better to use the indicator over longer timeframes because it’s more susceptible to false signals on smaller ones.
Camarilla Pivot Points Indicator: Buy/Sell Signals
To identify the buy signal and signal to sell, buyers must find the lines that are higher and lower. The lower line indicates support, and traders may take a long position, whereas the higher line is the resistance level where traders can go short.
You may also be able to enter in the middle of the lines, but it’s better to be patient and wait for the price action to take full form before you start taking positions. If you’d like to get further confirmation of a signal, you can employ other indicators such as MACD, the RSI, or MACD alongside these indicators.
Conclusion
The Pivot Points Camarilla Indicator utilizes Fib numbers for drawing levels of resistance and support. Additionally, you can download the indicator at no cost on our website.