Overlay Chart Indicator
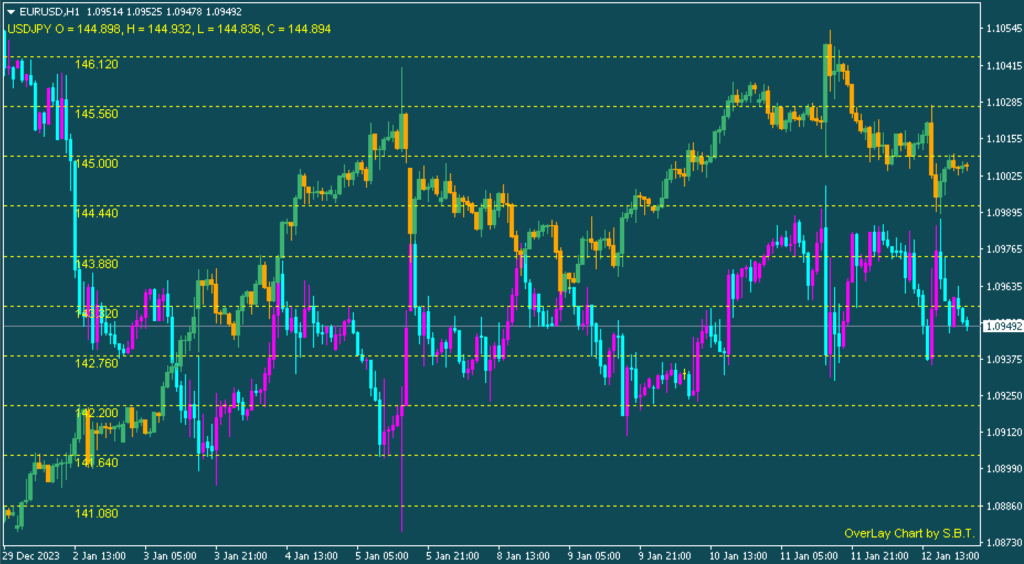
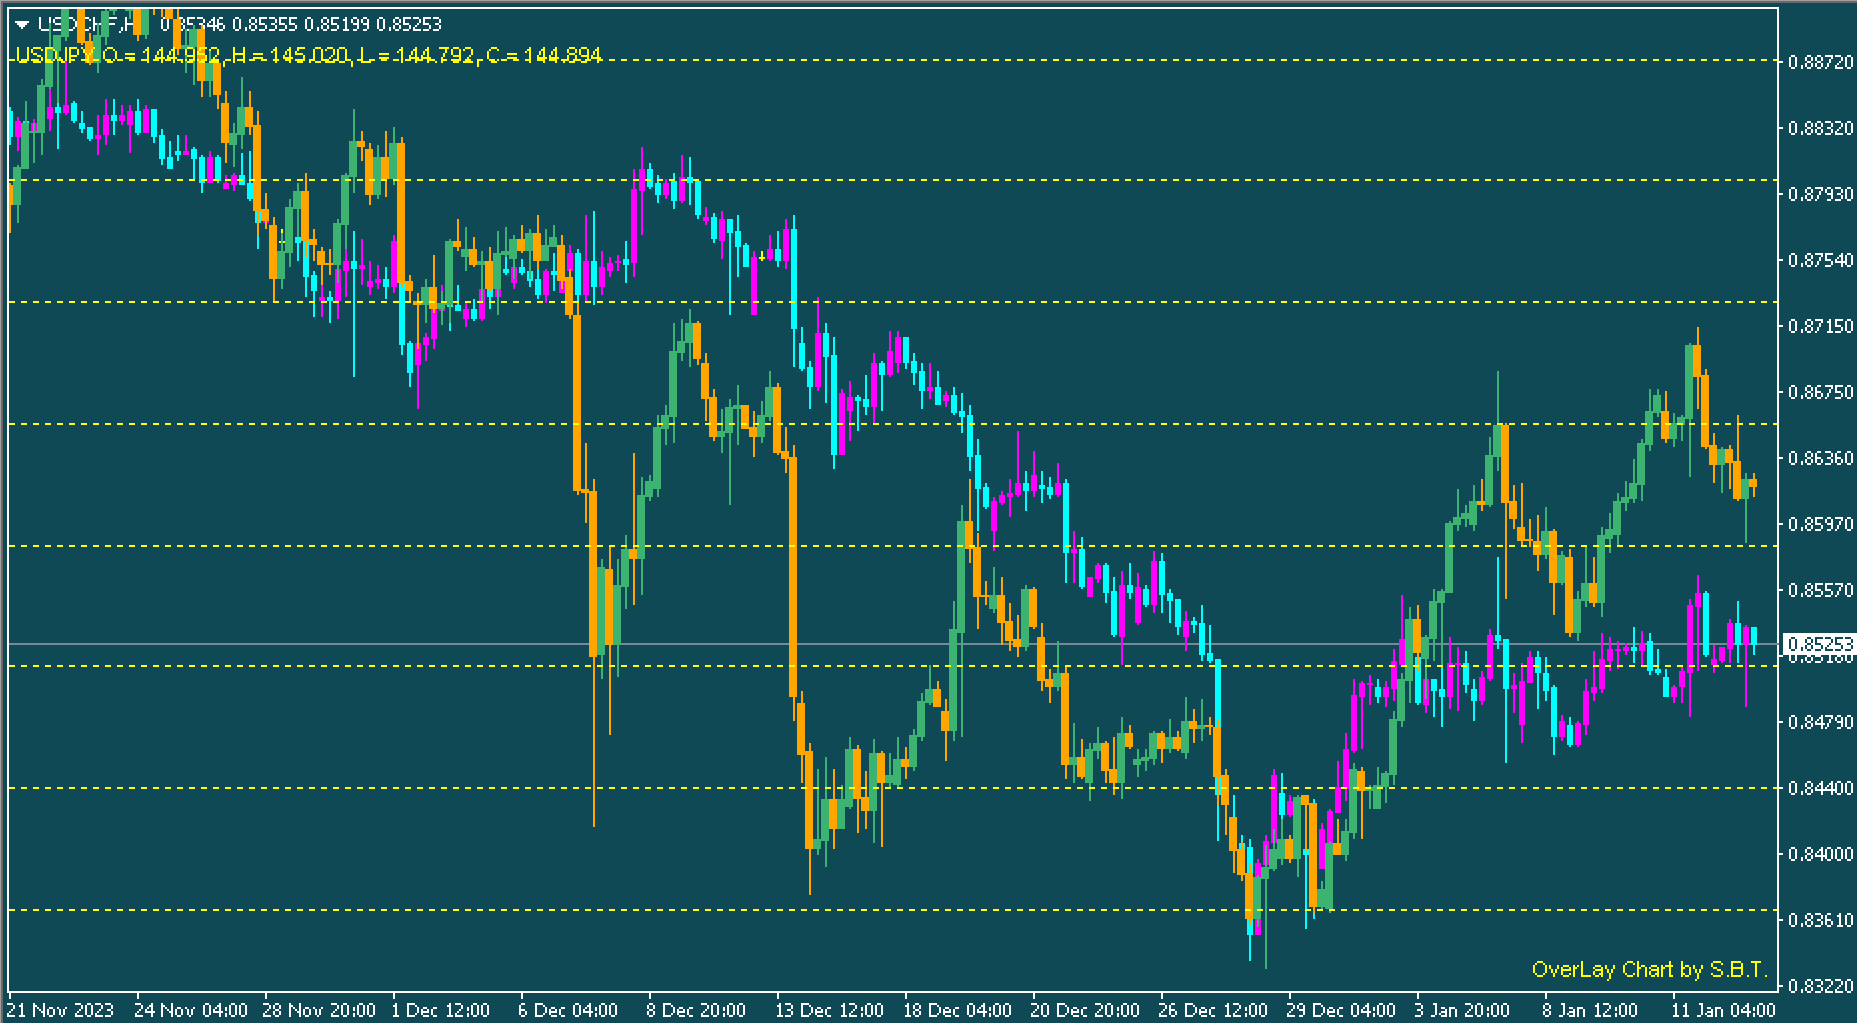
This overlay chart indicator is an indicator in MT5 that compares the price actions of two currencies. The indicator shows two prices simultaneously to show the price action of two currencies. In addition to price, the indicator also reveals the high open, low, and closing of the pair, indicating that it is overlapping.
It is possible to open positions in both pairs by looking at the price movement of both pairs. The indicator operates according to the principles of Forex correlation. In forex, the term “currency correlation” refers to the relationship that is either positive or negative between two currencies. A positive correlation suggests that the two currencies move in the same direction. On the other hand, the opposite of a negative correlation means that they are moving in a different direction.
When two pairs are linked, it is possible that the overlay chart indicator will apply to both pairs simultaneously. While you can apply this Overlay Chart indicator to any timeframe, it’s best to use it for longer timeframes.
Overlay Chart Indicator Buy/Sell Signals
To recognize buy and sell signals, traders should keep an eye on price actions. The overlay has bars in orange and green, which illustrate both bearish and bullish signals. Green bars suggest a bullish trend, whereas orange bars suggest a bearish trend.
For the pair that was originally created, traders need to be attentive to the price and take their positions in line with the price action. The indicator is most efficient; however, it’s difficult to discern the price’s movement. Therefore, you must employ other technical indicators like RSI as well as MACD to find the appropriate entry and exit locations.
What is an overlay in technical analysis?
Overlay analysis involves putting the price action over the price action that is currently in place. This allows traders to compare two price movements at the same time. The analysis of the technical aspects of the overlays is performed with indicators like the indicator that overlays charts.
What are overlay indicators?
Overlays indicators display price changes on top of the current price and, consequently, are able to overlap. The overlay indicator works in tandem with the actual price movement, and traders can therefore trade in line with the price.
Conclusion
This overlay chart indicator places another price action for a particular pair on top of the initial price action. When comparing two price actions, traders can then trade their positions according to. You can also download the indicator at no cost on our site.