Regression Channel Indicator

The Polynomial Regression Channel indicator for MetaTrader is the most reliable indicator to determine an underlying trend channel in the price. It’s flexible and operates perfectly in line with the direction of the trend and the volatility. This is different from other channel indicators that reveal price channels that have straight lines.
This indicator can help you identify possible reverse zones in the price. It also defines the bias of trends (short-term as well as long-term) in the marketplace. This could help you open a trading position to see in what direction the market is heading.
The upper and lower bands in the indicator’s channel can be overbought or oversold zones that serve as active levels of support or resistance. Additionally, they (upper as well as lower bands) can also serve as zones for buying and selling. The middle band, however, is the one that defines the strength of the trend as an asset.
This suggests that it is likely that the Polynomial Regression Channel indicator would be an excellent trading tool for both counter-trend and trend traders. The indicator was created to help you find trading opportunities across different market conditions.
In addition, it is chart-friendly and simple to use. It is recommended for beginners as well as intermediate and skilled forex traders. It can also be useful when determining scalping, day/intraday, and potential swing trading opportunities.
How to Trade with the Polynomial Regression Channel
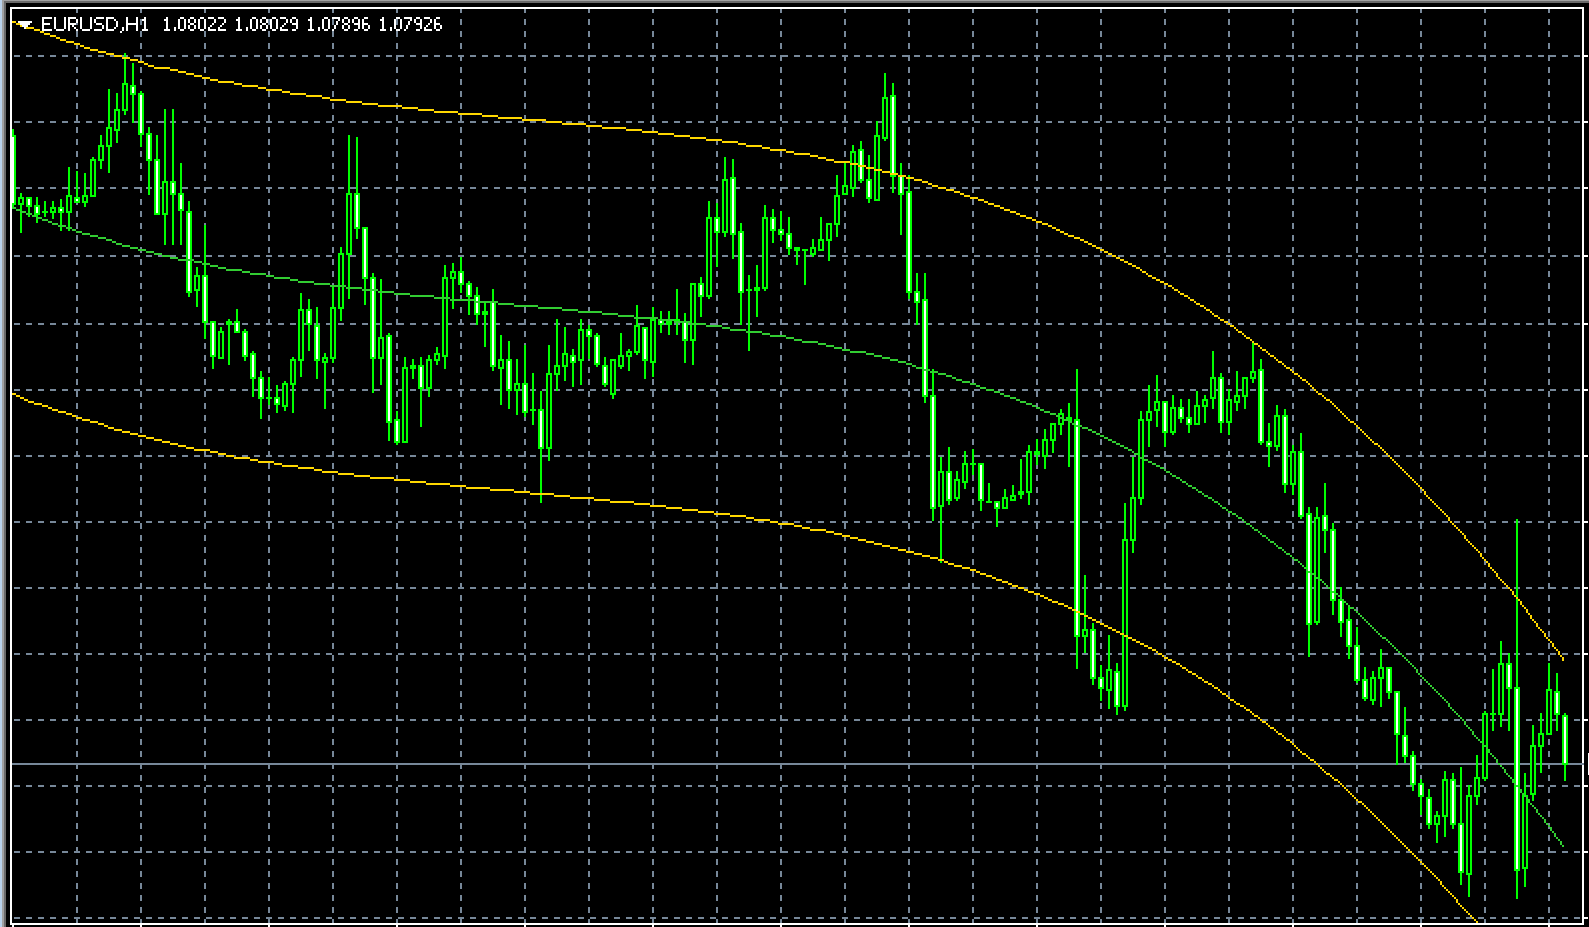
The image above illustrates how the indicator will appear on the MT4 chart. It also demonstrates how to spot the most likely winning strategy. In addition, it is recommended that this polynomial regression channel indicator be utilized in conjunction with other technical indicators or price action to increase performance.
The fundamental principle of trading is opening a buy/sell order when the price is trending towards the upper or lower bands of this indicator. The most effective method to trade an indicator like this is to wait for it to respond (reject) towards the band below and then create a bullish candle prior to making a buy order.
Refer to the screenshot above for a better understanding. Additionally, you can follow your stop loss once the price rises over (for buy trades) and below (for sell trades) that middle band of the indicator. You can also take profit on the opposite end of the band.
Conclusion
The Polynomial Regression Channel indicator for MT4 is a simple trading indicator that helps identify areas of trend reversal and define the bias towards trend in the market. Additionally, it’s ideal for both counter-trend and trend forex traders. The indicator is accessible for download at no cost.