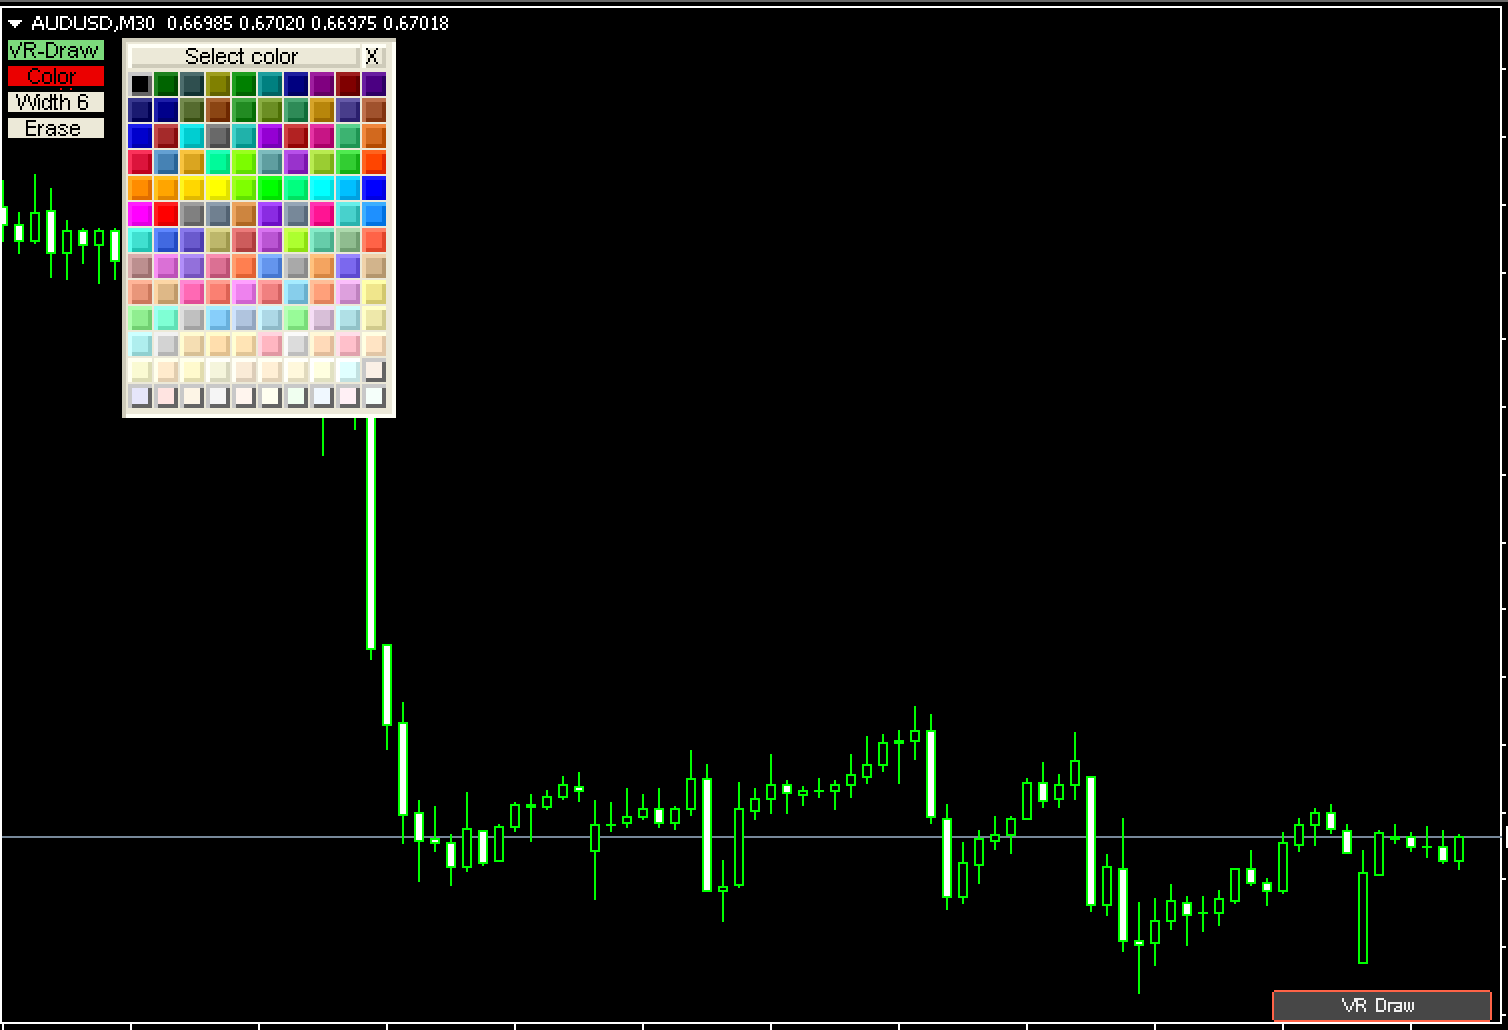
VR Draw is not an automated trading tool. It enhances your trading by allowing you to draw on charts. You do not need to use screenshots or other third-party software to make marks on charts. You can draw on the chart. It is very useful for teaching or trading.
How to use the indicator
The indicator is not a trading signal. It allows you to draw whatever you want to enable you to detect signals. You can, for example, draw your own custom support and resistance lines.
You can also choose from a variety of color schemes. You can, for example, choose to use red circles and blue curves. This is a great tool for marking the different areas of interest, and to help visualize your trading ideas.
You can also increase or decrease width using the indicator. You can, for example, increase the width if you want certain tools to be more prominent. You can also erase any drawing by using an eraser.
Draw Trading Example
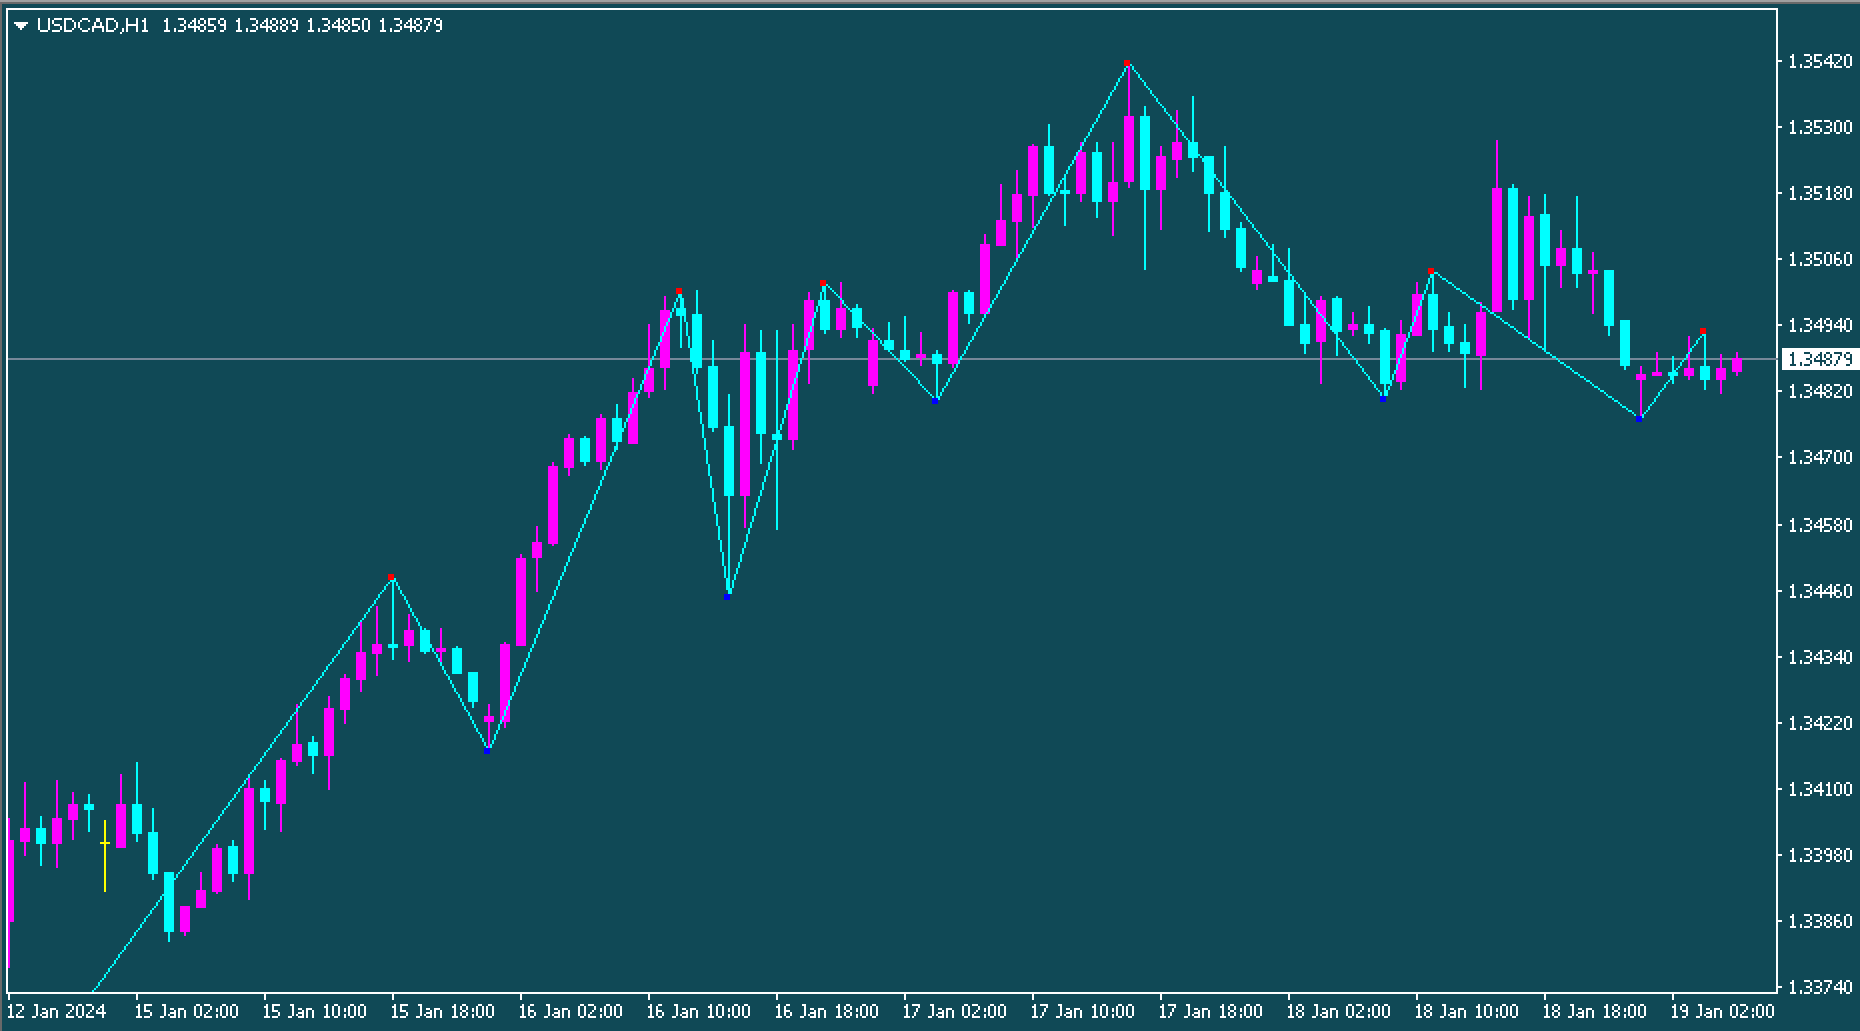
The chart below shows the US dollar’s price movement against the Canadian Dollar over a period of 15 minutes. VR draw was used to create a swing. This tool allows you to draw a wide variety of colors and designs.
The conclusion of the article is:
Even experienced traders have difficulty marking certain areas of the chart. VR draw has made it easy to mark certain areas on the chart. The VR draw can be used to enhance the trading experience, and interact with charts. After the training session, you can use the eraser on the drawing to remove it.


