RSI Divergence Indicator
The RSI divergence indicator can signal traders if neither the price action nor the RSI indicator shows the same trend.
The RSI (Relative Strength Index) is a momentum indicator that measures the rate of change in price to detect an overbought or oversold market.
It is a scale that ranges between 0 and 100. If the Relative Strength Index is found to drop below 30, the market is considered oversold. If the index value exceeds 70, then the market is considered overbought.
The absence of a signal is one of the most important problems that arise when using the indicator. The indicator is not able to reach oversold and overbought levels.
Divergence helps you to determine the time when the market is most likely to return to its previous trend after an upward pullback.
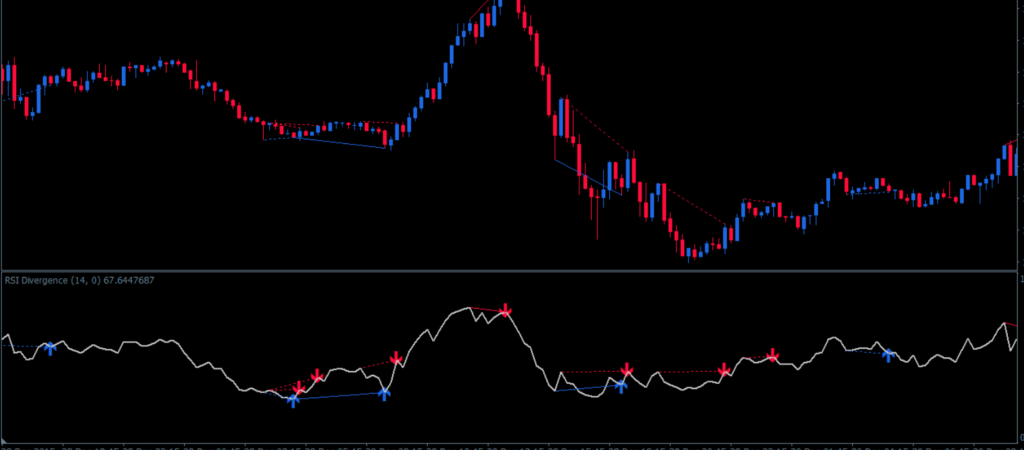
If the chart shows an RSI divergence, then the relative strength index on the chart will produce a lower high. This is the case when the price makes a higher high. Conversely, the price indicator shows higher lows when price makes lower lows.
RSI divergence is when the index fails to break to a higher high in an uptrend, or to a lower low in a downtrend.
This divergence signals that the current trend is losing momentum. It may signal a warning and an opportunity to place a bet on a possible reversal of price movement to the opposite direction.
Buy/Sell Signals for the RSI Divergence Indicator
In order to find buy or sell signals using this indicator, you must find both bearish and bullish divergences. A bullish divergence will provide a buyer signal and a bearish divergence will provide us with a sell signal.
Buy signals
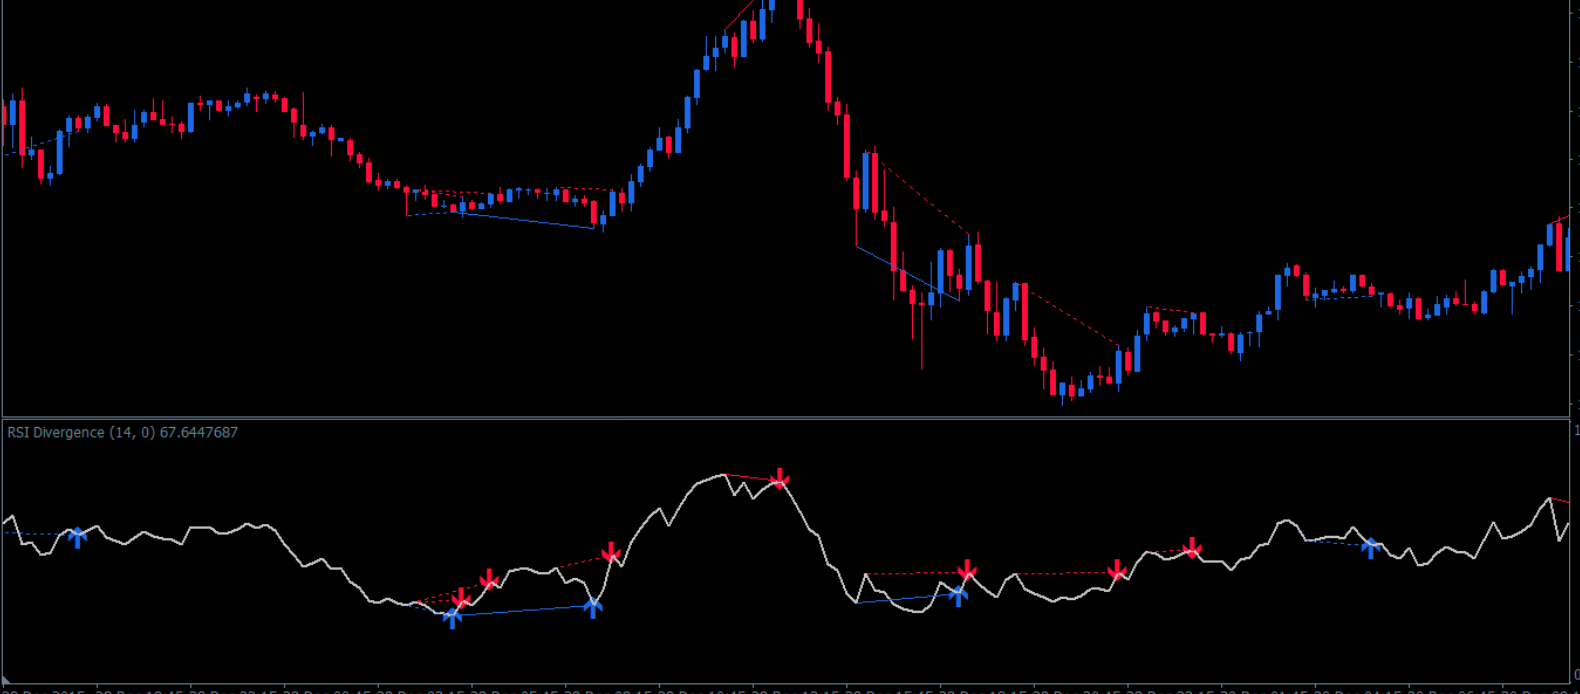
The chart above shows an uptrend. As you can see, we enter the market when we have lower highs and oversold conditions in our indicators. This indicates a bullish divergence.
You can either stay put until the candle confirms, or enter once the RSI crosses the oversold territory. You can place a stop loss close to the previous session’s low and exit the trade once it becomes clear that the RSI divergence is starting to slide.
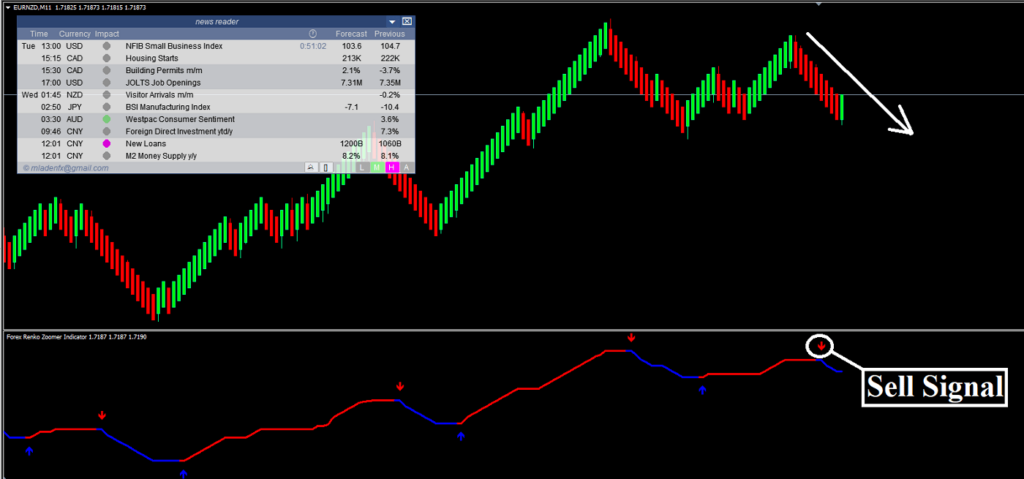
Sell signals
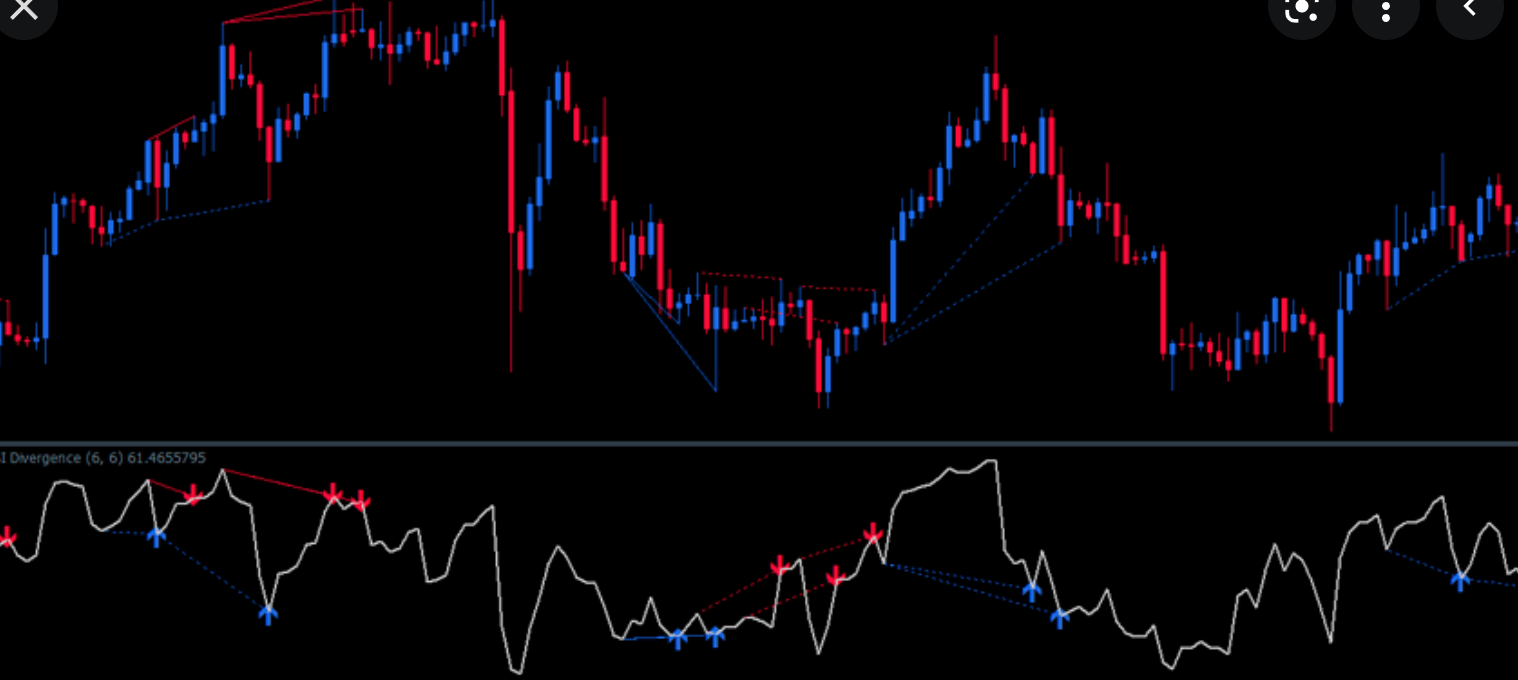
In the chart above, you can see that there was a period when the divergence indicator had a higher low when it was and overbought situation. The price retraces, but it eventually continues its downtrend.
We started trading after the RSI Divergence Indicator clearly showed an overbought condition, stopped out near the recent high and took off when the RSI Divergence Indicator clearly started climbing upwards.


Responses