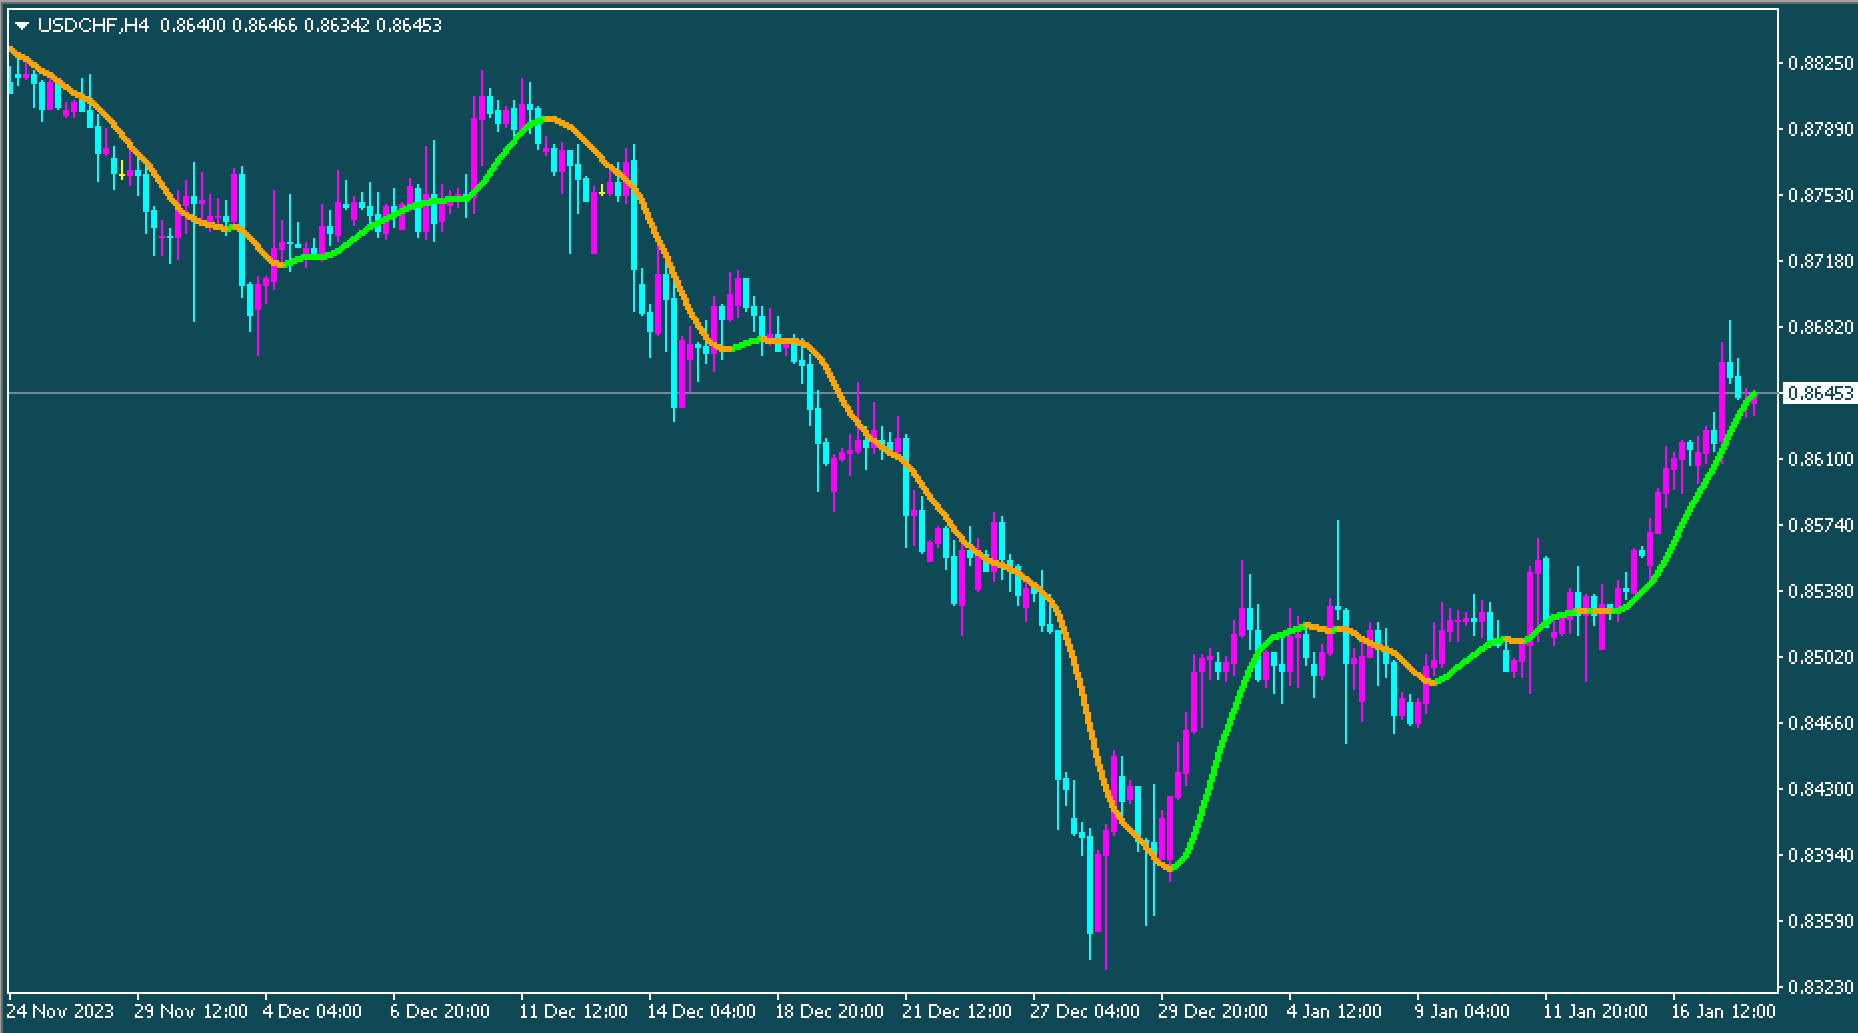
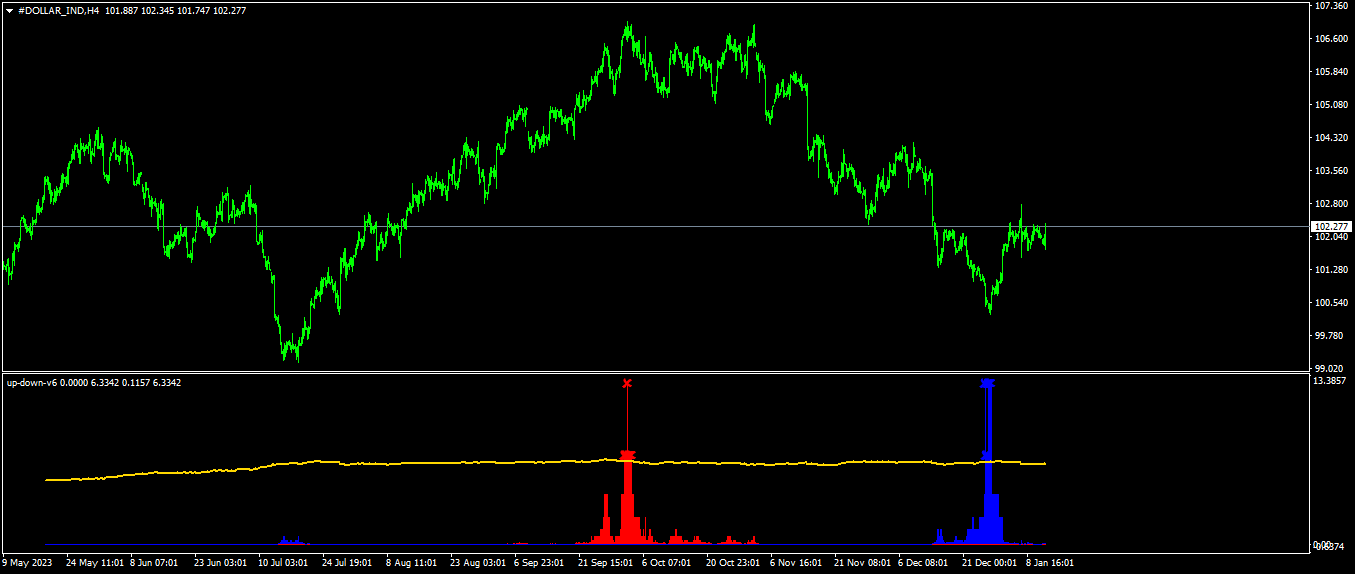
Many traders utilize the use of moving averages to identify and exploit trends. However, Fibonacci ratios appear in nature and even in the markets. Trading professionals use these ratios to identify areas of interest, which act as support and resistance levels. How do you mix moving averages with indicators like the Fibonacci indicator for technical analysis? You get an accurate Fibonacci-based moving average indicator to identify trends and ideal starting and ending points.

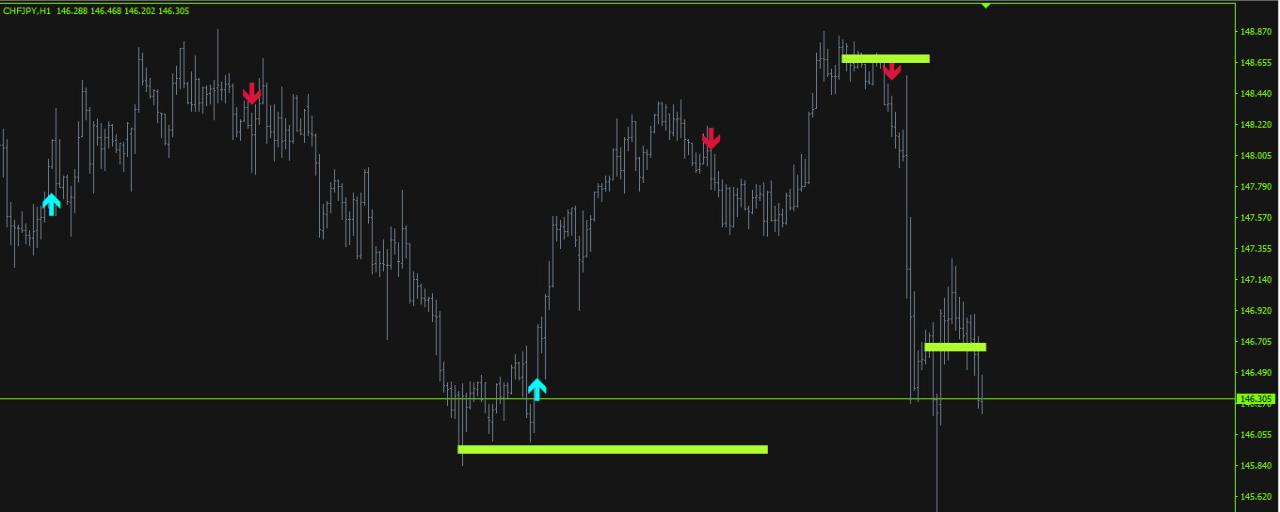
Buy and sell signals based on Fibonacci moving averages
Buy when the short term moving average crosses the long term moving average.
Sell when the short term moving average is below the long term moving average.
Exit Strategies
Stop loss at a distance below the swing low or above the swing high.
Set a profit target above the next resistance or support zone.
Price fluctuations. The short-term moving average is moving downward, below the long-term moving average. This indicates a continuing downtrend. Therefore, it is recommended to go short or even add to your position.
Conclusion
There is no doubt that this Fibonacci indicator is undoubtedly one of the top technical tools. Using the Fibonacci ratio to calculate moving averages is probably one of the most innovative trading concepts. It is definitely worth trying.


